Illustrative Mathematics
Dividing by One-Half
Understanding when to divide by two or one-half can be confusing. Here is an activity that gives four different scenarios. It is up to your number crunchers to decide if they divide by two or one-half. The easiest way to approach the...
Curated OER
Task: Range of Motion
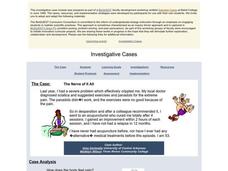
If you have ever injured your shoulder, you know it takes a while to improve your arm's range of motion. In this real-world example, young mathematicians gain insight into the world of physical therapy while they analyze a case study...
Mt. San Antonio Collage
Circles
Don't circle around the topic, but get right to the center with tons of practice regarding circles in geometry. The note-incorporated worksheet provides guided practice through many topics such as central angles, inscribed polygons...
Captain Planet Foundation
Fall into Healthy Shapes
Kindergartners identify geometric shapes by planting a fall garden. They start their seeds in containers that have different shapes, and keep track of their plants based on those shapes. This brilliantly designed and incredibly thorough...
EngageNY
Describing Variability Using the Interquartile Range (IQR)
The 13th activity in a unit of 22 introduces the concept of the interquartile range (IQR). Class members learn to determine the interquartile range, interpret within the context of the data, and finish by finding the IQR using an...
Noyce Foundation
Cat Food
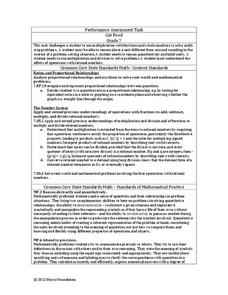
Determine the right mix of cans of cat food. The resource consists of an assessment task to determine the cost to feed two cats for a specific number of days and requires scholars to interpret remainders within a context....
EngageNY
Ratios II
Pupils continue the study of ratios by creating ratios from a context. The contexts present more than two quantities, and scholars create contexts that match given ratios.
EngageNY
Connecting Graphical Representations and Numerical Summaries
Which graph belongs to which summary statistics? Class members build upon their knowledge of data displays and numerical summaries to connect the two. Pupils make connections between different graphical displays of the same data in...
Inside Mathematics
Population
Population density, it is not all that it is plotted to be. Pupils analyze a scatter plot of population versus area for some of the states in the US. The class members respond to eight questions about the graph, specific points and...
Inside Mathematics
Number Towers
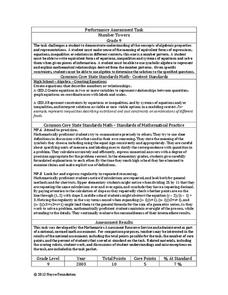
Number towers use addition or multiplication to ensure each level is equal. While this is common in factoring, it is often not used with algebraic equations. Solving these six questions relies on problem solving skills and being able to...
Inside Mathematics
Graphs (2004)
Show your pupils that perimeter is linear and area is quadratic in nature with a short assessment task that requests learners to connect the graph and equation to a description about perimeter or area. Scholars then provide a...
EngageNY
Equivalent Ratios Defined Through the Value of a Ratio
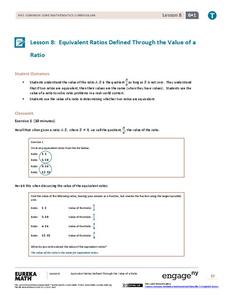
Ratios may not be created equal, but they are equivalent. Pupils learn the theorem relating equivalent ratios and equal values in the eighth segment in a series of 29. Classmates use the theorem to determine whether ratios within...
Noyce Foundation
Sewing
Sew up your unit on operations with decimals using this assessment task. Young mathematicians use given rules to determine the amount of fabric they need to sew a pair of pants. They must also fill in a partially complete bill for...
Inside Mathematics
Quadrilaterals
What figure is formed by connecting the midpoints of the sides of a quadrilateral? The geometry assessment task has class members work through the process of determining the figure inscribed in a quadrilateral. Pupils use geometric...
EngageNY
Describing Distributions Using the Mean and MAD II
The 11th lesson in the series of 22 is similar to the preceding lesson, but requires scholars to compare distributions using the mean and mean absolute deviation. Pupils use the information to make a determination on which data set is...
Fluence Learning
Writing About Literary Text: Pygmalion and Galatea
Is it crazy to fall in love with your own work, or is that the purest love of all? Compare two renditions of the classic Greek myth Pygmalion and Galatea with a literary analysis exercise. After students compare the similarities and...
EngageNY
Tides, Sound Waves, and Stock Markets
Help pupils see the world through the eyes of a mathematician. As they examine tide patterns, sound waves, and stock market patterns using trigonometric functions, learners create scatter plots and write best-fit functions.
Inside Mathematics
Quadratic (2009)
Functions require an input in order to get an output, which explains why the answer always has at least two parts. After only three multi-part questions, the teacher can analyze pupils' strengths and weaknesses when it comes to...
EngageNY
Logarithms—How Many Digits Do You Need?
Forget your ID number? Your pupils learn to use logarithms to determine the number of digits or characters necessary to create individual ID numbers for all members of a group.
Noyce Foundation
Cereal
Find the best protein-packed cereal. The short assessment task covers equivalent and comparing ratios within a context. Pupils determine the cereal with the highest ratio of protein. A rubric helps teachers with point allotments for...
EngageNY
Using Permutations and Combinations to Compute Probabilities
Now that we know about permutations and combinations, we can finally solve probability problems. The fourth installment of a 21-part module has future mathematicians analyzing word problems to determine whether permutations or...
Mathematics Vision Project
Module 7: Modeling with Functions
The sky's the limit of what you create when combining functions! The module begins with a review of transformations of parent functions and then moves to combining different function types using addition, subtraction, and...
EngageNY
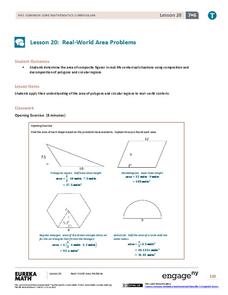
Real-World Area Problems
Not all structures take the shape of a polygon. The 21st lesson in a series of 29 shows young mathematicians they can create polygons out of composite shapes. Once they deconstruct the structures, they find the area of the composite figure.
Fluence Learning
Construct Viable Arguments About Adding Fractions
Test mathematicians' knowledge of adding fractions with a brief assessment that challenges them to play teacher while correcting a peer's work. Scholars examine Carl's mathematical response, identify where he went wrong,...
