Curated OER
Representing Data 1: Using Frequency Graphs
Here is a lesson plan that focuses on the use of frequency graphs to identify a range of measures and makes sense of data in a real-world context as well as constructing frequency graphs given information about the mean, median, and...
Agile Mind
Cake Weighing
An online set of four yummy questions addresses number sense for sixth graders. They place points on a number line, determine relative values, interpret absolute value, and apply their understanding to the weighing of cakes for a bakery....
Natinal Math + Science Initative
Slope Investigation
Context is the key to understanding slope. A real-world application of slope uses a weight loss scenario with a constant rate of change to introduce the concept of slope of a line, before it makes a connection to the ordered pairs...
American Statistical Association
Colors Challenge!
Does writing the name of a color in a different colored ink affect one's ability to read it? Scholars design an experiment to answer this question. They collect the data, analyze the statistics, and draw a conclusion based on...
Statistics Education Web
Walk the Line
How confident are you? Explore the meaning of a confidence interval using class collected data. Learners analyze data and follow the steps to determine a 95 percent confidence interval. They then interpret the meaning of the confidence...
Illustrative Mathematics
Crude Oil and Gas Mileage
Here is an activity that presents a real-world problem about the relationship between crude oil production and the gas mileage of modern automobiles. After learners write functions to describe the relationships, they are asked to...
Curated OER
As the Wheel Turns
This is not your typical Ferris wheel problem. In this exercise, your class will combine their knowledge of sinusoidal functions as well as linear motion to come up with parametric equations that model the position of a point on the edge...
Illustrative Mathematics
Riding at a Constant Speed, Assessment Variation
Practice ratios and unit rates with tracking how long Lin took to ride her bike. Provided with different questions, your mathematicians can assemble their answers using a chart or setting up ratios. The activity is included in a set of...
Illustrative Mathematics
Fishing Adventures 2
This resource is part of a series which expects participants to be familiar with graphing inequalities on a number line. It is a word problem that asks your class to graph a discrete solution set and interpret it in the context of an...
Illustrative Mathematics
Writing Constraints
Use this resource to present your number crunchers with how to write a constraint equation and to determine viable solutions. The price of an object limits the amount that can be purchased. The speed at which you walk limits the number...
Illustrative Mathematics
Making Hot Cocoa, Variation 2
Learners are introduced to dividing by fractions in a visual way. Setting up groups from the information in the problem allows them to see what we divide and why. Use with the previous lesson, which can be found in Additional Materials,...
Illustrative Mathematics
Half of a Recipe
Kids love to cook! What is a better place to learn mixed numbers than with a recipe? It is up to learners to decide how they want to divide this recipe in half. They may choose to model the mixed number and then divide the model by two....
Illustrative Mathematics
Kitchen Floor Tiles
An interesting way to look at the kitchen floor is to count the number of tiles in the border. Fred starts with four white floor tiles and writes an expression for the number of tiles needed for the colored border. Algebra learners are...
Curated OER
Course of Antibiotics
This model of the amount of anibiotics in a person's system is represented abstractly by a finite geometric series. Learners translate this real-life situation into algebraic form and then extend their knowlege by answering questions...
Curated OER
Accurately Weighing Pennies I
Drawing from a scenario of the history of the penny, learners write and solve a system of linear equations from a context.
Curated OER
Bernardo and Sylvia Play a Game
This activity presents a game played by two learners whose solution is an exercise in creating and analyzing with algebraic inequalities.
Curated OER
Basketball Bounces, Assessment Variation 1
This highly scaffolded, summative assessment tasks learners to choose the model that represents the height of a bouncing basketball given the data in graph and table form. Learners then use the model to answer questions about the...
Curated OER
Mixing Fertilizer
Your young landscapers do concentration calculations in this problem dealing with mixing fertilizer. Learners use and analyze rational expressions within this context.
Curated OER
Forms of Exponential Expressions
Your young physicists analyze the forms of four equivalent exponential expressions representing an amount of a radioactive material in a substance. They show how each expression is equivalent to the others and what aspects of the decay...
Curated OER
Fishing Adventures 3
Your young boaters will enjoy writing and solving inequalities, and representing the solution graphically in this task set in the context of renting a boat.
Curated OER
Seeing Dots
Your algebra learners interpret algebraic expressions, in order to compare their structures, using a geometric context. They also discern how the two expressions are equivalent and represent a pattern geometrically and algebraically.
Curated OER
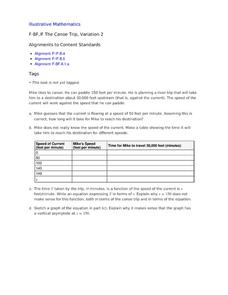
The Canoe Trip, Variation 2
The behavior of a rational function near a vertical asymptote is the focus around this trip up a river. Specifically, numerical and graphical understanding is studied. The canoe context pushes the variables as numbers, rather than as...
Curated OER
Cell Phones
Your texters will enjoy assessing their knowledge of function notation in this simple set of exercises. They will also interpret function notation in terms of the given context.
Curated OER
US Households
Learners construct and use inverse functions to model a real-world context. They use the inverse function to interpolate a data point.


