Regents Prep
Activity to Show Sample Population and Bias
There is bias in many aspects of our lives, and math is no exception! Learners explore provided data to understand the meaning of biased and random samples. The resource includes various data sets from the same population, and...
Curated OER
M&M Graphing
Youngsters sort M & M's by color. They graph the M&M's by color on a graph. This classic instructional activity is a wonderful way to introduce the concept and technique of graphing to young mathematicians. Pairs of kids can make...
Curated OER
Rescue Mission Game
Students conduct probability experiments. For this rescue mission lesson, sudents play a game and collect statistical data. They organize and interpret the data and determine the probability of success. Students plot points on a...
EngageNY
Comparing Data Distributions
Box in the similarities and differences. The 19th lesson in a unit of 22 presents class members with multiple box plots to compare. Learners use their understanding of five-number summaries and box plots to find similarities and...
University of Utah
Statistics-Investigate Patterns of Association in Bivariate Data
Young mathematicians construct and analyze patterns of association in bivariate data using scatter plots and linear models. The sixth chapter of a 10-part eighth grade workbook series then prompts class members to construct and interpret...
CCSS Math Activities
Smarter Balanced Sample Items: 7th Grade Math – Target H
Not one but two box plots. How will your pupils fare? Assess their understanding of box plots by having them compare two populations. The eighth of nine installments in the Gr. 7 Claim 1 Item Slide Shows series, the resource has them...
Radford University
Are Kitchen Cabinets at the Correct Height? Lessons 1-5
Here's a not-so-normal unit on normal heights. Future statisticians anonymously collect class data on female heights, weights, and shoe sizes. They then analyze the data using normal distributions, z-scores, percentiles, and the...
Curated OER
Gold Rush California and its Diverse Population
Students compare contemporary cultural differences with historical differences based on population percentage. In this cross-curriculum Gold Rush/math lesson, students analyze aspects of California's Gold Rush population and diversity...
Curated OER
Extra Credit: It’s No Fairy Tale
Students discuss their knowledge of payday loans and credit cards. In this Economics lesson, students complete a read an article and Q&A activity in groups, and play a vocabulary bingo game and a quiz game on payday loans. Students...
Curated OER
Quarter, Nickel, Dime....
An engaging game called, "Quarter, Nickel, and Dime" is presented in this math lesson. Players are given an envelope with slips of paper that represent the three coins. In pairs, they play the game 18 times, and the whole class charts...
Curated OER
What's in a Number? Analyzing Smoking Statistics
Sixth and seventh graders analyze smoking statistics. In this health lesson, learners look at the percentage of people who smoke from each race group. They create a bar graph and circle graph that displays this information.
Teach Engineering
Applying Statistics to Nano-Circuit Dimensions in Fabrication
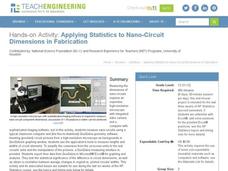
Do flexible circuits change dimensions during fabrication? Groups use GeoGebra software to measure the length of pictures of flexible nano-circuits. To determine if the circuits change dimensions, future engineers use Microsoft Excel to...
K20 LEARN
Do Placebos Kill Minotaurs?
But it's just a game! Learners play a game to learn basic concepts of statistical hypothesis testing. After using the digital-game module, pupils develop their own statistical hypotheses and test them.
Curated OER
Matchstick Math: Using Manipulatives to Model Linear, Quadratic, and Exponential Functions
Playing with matches (unlit, of course) becomes an engaging learning experience in this fun instructional unit. Teach pupils how to apply properties of exponential functions to solve problems. They differentiate between quadratic and...
Statistics Education Web
Did I Trap the Median?
One of the key questions in statistics is whether the results are good enough. Use an activity to help pupils understand the importance of sample size and the effect it has on variability. Groups collect their own sample data and compare...
Shodor Education Foundation
Measures
Take a look at data from a statistical lens. An interactive allows pupils to enter data set, labeling the data including the units used. Manipulating the applet, learners select the statistics to calculate that include total, mean,...
Bowland
How Risky is Life?
"Life is more risk management, rather than exclusion of risks." -Walter Wriston. Scholars use provided mortality data to determine how likely it is a person will die from a particular cause. They compare the data to the perception of the...
CK-12 Foundation
Introduction to Mean, Median, and Mode: The Tree Conundrum
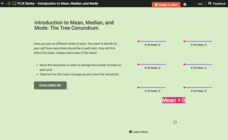
How many trees should we plant? Using an interactive as a manipulative, individuals find the mean, median, and mode for sets of data. They determine the number of trees to plant in each plot of land to reach a statistical goal.
Federal Reserve Bank
Insurance Inventory
Do you have enough insurance? Pupils may be surprised to learn how much their possessions are worth. This activity asks them to create an inclusive list and make a comparison to their insurance coverage. According to the statistics, most...
Pace University
Grade 7 Earth Day Statistics with Circle and Bar Graphs
Take a tiered approach to studying waste. The lesson uses Earth Day to present differentiated instruction around using circle and bar graphs. Each group gets a cube based on their tiers and works collaboratively as well as individually...
Mathalicious
Domino Effect
Carryout the lesson to determine the cost of pizza toppings from a Domino's Pizza® website while creating a linear model. Learners look through real data—and even create their own pizza—to determine the cost of each topping. They explore...
Curated OER
Statistics Related to the First World War
In this history and probability worksheet, students examine a chart of statistics associated with World War I which include total of men in the war by nation, number of deaths, and number of men taken prisoner. They answer 5 questions...
Curated OER
Statistics: Misleading or Accurate?
Students explore the concept of misleading statistics. In this misleading statistics lesson, students play a game of tag and graph the number of times each student gets tagged. Students use the graph to determine the fastest runner in...
Curated OER
Baseball Math
Fifth graders complete activity pages. In this operations and problem solving activity, 5th graders use the Internet to gather baseball statistics, solve problems and convert units.


