Virginia Department of Education
Linear Curve of Best Fit
Is foot length to forearm length a linear association? The class collects data of fellow scholars' foot length and the length of their forearms. They plot the data and find a line of best fit. Using that line, they make predictions of...
Math Worksheets Land
Multistep Ratio and Percent Word Problems - Step-by-Step Lesson
What happens when you have a recipe and need to up the measurements? Here is a lesson that explains how to use ratios to convert measurements and percents with worked out problems. Also provided are additional resources and practice...
Curated OER
TE Activity: Bubbling Plants
Students study a way to quantify the process of photosynthesis during a given time using the Elodea plant. They design a hypothesis that they test in the hands on activity. They compare the amounts of photosynthesis that occur during low...
Curated OER
Peter's Third String
Explore the solution to a word problem involving area and perimeter. Learners read and discuss how to approach the problem. In small groups, they determine the maximum area of a rectangle with a given perimeter using a piece of string....
Curated OER
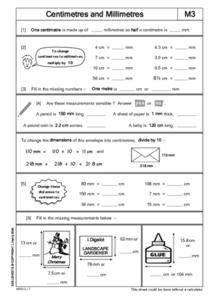
Centimetres and Millimetres
For this measurement worksheet, students convert centimetres to millimetres and millimetres to centimetres. Normal objects are used for examples of measurement.
Curated OER
Area and Perimeter Floor Plan
Using Google SketchUp, learners draw a model of their bedroom. They begin by measuring the dimensions of their bedroom, inputting this information into the software program, and calculating perimeter and area. This is an interesting and...
American Statistical Association
You and Michael
Investigate the relationship between height and arm span. Young statisticians measure the heights and arm spans of each class member and create a scatter plot using the data. They draw a line of best fit and use its slope to explain the...
Statistics Education Web
Now You SeeIt, Now You Don't: Using SeeIt to Compare Stacked Dotplots to Boxplots
How does your data stack up? A hands-on activity asks pupils to collect a set of data by measuring their right-hand reach. Your classes then analyze their data using a free online software program and make conclusions as to the...
Curated OER
Terrific Tessellations
Students construct tesselations that fosters their ability to create, transform, and critique their own piece of work. This allows them to become aware of repeated patterns in math, and connect these patterns to artwork.
EngageNY
Special Lines in Triangles (part 1)
Allow your pupils to become the mathematicians! Individuals explore the properties of a midsegment of a triangle through construction and measurement. Once they figure out the properties, learners use them to draw conclusions.
EngageNY
Comparison Shopping—Unit Price and Related Measurement Conversions
Speed up your scholars' understanding of ratios. Class members compare ratios related with speeds presented in different representations. They then use the unit rates to make the comparisons.
EngageNY
Comparison Shopping—Unit Price and Related Measurement Conversions II
Which rate is greater and by how much? Pupils continue to compare rates to solve problems in the 20th portion of a 29-part series. Rates are presented in a variety of representations either using the same representation or different...
Curated OER
History of Toys and Games
Young scholars research history of popular toys to learn when those toys were first introduced. They use measurement skills to create an accurate timeline.
Curated OER
Getting it Right! An Investigation of the Pythagorean Theorem
In order to learn about the Pythagorean Theorem, young mathematicians investigate relations and patterns between different sides of a right triangle to look for possible relations among the squared sides. Once they have established the...
Curated OER
Mirror, Mirror
Geometry young scholars use hinged mirrors to discover that the regular polygons are composed of triangles tessellating around a center point. They sketch triangles on paper models of the regular polygons having 3 to 10 sides and compute...
Utah Education Network (UEN)
Finding Missing Lengths of Similar Triangles
Middle and high schoolers explore the properties of similar triangles. In this geometry lesson, pupils play a similarity basketball game, sketch similar triangles, and find the missing measures of similar figures. They find the height of...
Curated OER
Representing Data 1: Using Frequency Graphs
Here is a lesson that focuses on the use of frequency graphs to identify a range of measures and makes sense of data in a real-world context as well as constructing frequency graphs given information about the mean, median, and range of...
Cord Online
Pyramids and Cones
Young mathematicians find the surface area and volume of a square pyramid and a cone. In what looks like a typical activity out of a textbook, you'll find an activity where learners find an unknown measurement of a pyramid or...
EngageNY
Solve for Unknown Angles—Transversals
Lead your class on an exciting journey through the world of math as they review geometry facts and solve for unknown angles. They learn how to use auxiliary lines and congruent angles to correctly complete each practice problem...
Curated OER
Monster Cars: Slope
Students examine how a rate is calculated from two points. Using battery operated cars, pairs of students measure time and distance. Afterward, they use this data to calculate the rate. Students then plot four ordered pairs and discover...
Texas Instruments
Drawing a Line Tangent to a Circle
Explore lines tangent to a circle. For this math lesson, learners manipulate circles and lines on a TI calculator. They draw a circle and analyze perpendicular lines intersecting the circle in only one place. This activity works...
Curated OER
Supplementary, Complementary, and Vertical Angles
By using circles that they cut out and label themselves, learners literally "get a grip" on the angles they identify: supplementary, complementary, and vertical. They solve missing measurements based on properties of supplementary,...
American Statistical Association
What is the Probability of “Pigging Out”
Learners apply their understanding of luck to a probability experiment. They play a game of Pass the Pigs to determine the probability of a specific outcome. Using analysis for their data, pupils declare the measures of center, dot...
Baylor College
Do Plants Need Light?
Turn your classroom into a greenhouse with a lesson on plant growth. First, investigate the different parts of seeds, identifying the seed coat, cotyledon, and embryo. Then plant the seeds and watch them grow! Measure the new plants...
Other popular searches
- Perimeter Math Measurement
- Math Measurement Inches
- Math Measurement Lesson Plans
- Math Measurement Length
- Math Measurement Metric
- Esl Math Measurement
- Math Measurement Worksheets
- Esol Math Measurement
- Math Measurement Lessons
- Liquid Measurement in Math
- Measurement/math Literature
- Angle Measure Math


