Curated OER
Exploring Height with Abe Lincoln
Students examine a life-size count out of Abraham Lincoln to get a visual comparison of their height and Lincoln's. They work in pairs and trace each other's body and measure from head to toe in inches using a ruler. They then subtract...
Education World
Predicting Pumpkins
If you want more pumpkin seeds, you should get a bigger pumpkin—right? Young harvesters use estimation skills to make a hypothesis about how many seeds they will find in a pumpkin before examining the real number inside.
EngageNY
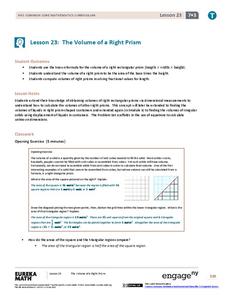
The Volume of a Right Prism
Does the volume formula work even if the measurements are not whole numbers? Class members work simple problems to find that the formula (area of the base) × (height) works for all prisms, independent of measurements and shape.
Willow Tree
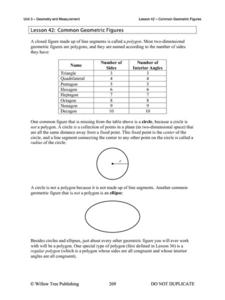
Common Geometric Figures
Geometry could be called the study of figures. An overview of the figures found in a typical geometry course contains a study of different triangles, quadrilaterals, and regular polygons.
K20 LEARN
From Another Dimension: Intro To Dimensional Analysis
Hold measurements to a different metric. Class members convert the measurements of a dog's tumor to explain the size to its owner. Using cards, learners match metric measurements with their English equivalents. They then read articles to...
Willow Tree
Angles Formed by Transversals of Coplanar Lines
Create a strong understanding of the relationships formed when parallel lines intersect a transversal. Discuss each type of angle pair and their relationship to each other.
Willow Tree
Box-and-Whisker Plots
Whiskers are not just for cats! Pupils create box-and-whisker plots from given data sets. They analyze the data using the graphs as their guide.
EngageNY
Conditions for a Unique Triangle—Two Angles and a Given Side
Using patty paper, classes determine that only one triangle is possible when given two specific angle measures and a side length. As the 10th instructional activity in the series of 29, young math scholars add these criteria to those...
Project Maths
Inequalities
Which number is bigger? Using a variety of activity sheets, this unit starts with the basics of inequalities and progresses through solving compound linear inequalities. Problems cover the range of inequalities including inequality word...
NASA
Lights on the International Space Station
Groups explore illumination with NASA's Lighting Environment Test Facility (LETF) as a context. Using the TI-Nspire app, groups determine the lux equation that models their simulation. They then use the lux equation to...
Statistics Education Web
Saga of Survival (Using Data about Donner Party to Illustrate Descriptive Statistics)
What did gender have to do with the survival rates of the Donner Party? Using comparative box plots, classes compare the ages of the survivors and nonsurvivors. Using the same method, individuals make conclusions about the...
West Contra Costa Unified School District
Parallel Lines Cut by a Transversal
Parallel lines seem so right for each other. It's too bad they'll never, ever meet. Learners use tracing paper to discover relationships among angles formed by two parallel lines cut by a transversal. They apply this information to find...
Curated OER
Double-the-Design Yarn Paintings!
Learners cut yarn into several different lengths and fold paper in half, using skills for measuring and fractions. Then they use unconventional items (yarn) as tools to create mirror-image art and experience first-hand the math idea of...
EngageNY
Drawing Parallelograms
Construct your young mathematicians' understanding by exploring the properties and dimensions of a parallelogram through constructions. The seventh instructional activity in this 29-part series begins with individuals creating...
EngageNY
Slicing a Rectangular Prism with a Plane
What do you get when you slice a prism? Pupils discover that the answer depends on how the prism is sliced. The second half of the 29-part module focuses on three-dimensional objects. Learners use their two-dimensional vocabulary and...
Statistics Education Web
How Wet is the Earth?
Water, water, everywhere? Each pupil first uses an Internet program to select 50 random points on Earth to determine the proportion of its surface covered with water. The class then combines data to determine a more accurate estimate.
Curated OER
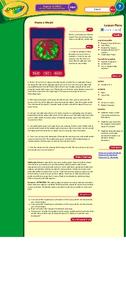
Weave a Wreath
Students follow directions to complete a multi-step process that results in an attractive holiday decoration. In this Christmas art activity lesson, students employ simple measuring and weaving techniques and experiment with the negative...
Statistics Education Web
Did I Trap the Median?
One of the key questions in statistics is whether the results are good enough. Use an activity to help pupils understand the importance of sample size and the effect it has on variability. Groups collect their own sample data and compare...
Curated OER
Weave a Wreath
Students employ simple measuring and weaving techniques. Then they experiment with the negative and positive space of a cutout. Students also follow directions to complete a multi-step process that results in an attractive holiday...
Curated OER
Box-and-Whisker Plots
Eighth graders measure in feet and inches and convert to explore the relationship between the converted measurements. In this measurement activity, 8th graders use the whisker and box plot to represent the measurement of a cat. ...
Curated OER
Grams and Kilograms
Fourth graders participate in scavenger hunts for objects that weigh a gram and a kilogram. In this metric measure lesson, 4th graders use a spring scale to measure objects they believe weigh a gram and a kilogram. Students complete...
Alabama Learning Exchange
Mr. Crocodile's Busy Day
Demonstrate how to read analog and digital clocks to the hour in this time measurement lesson. Read the book What Time is it Mr. Crocodile? and use Mr. Crocodile's schedule to practice telling time. They work in cooperative groups to...
Curated OER
Celsius to Fahrenheit
Students convert degrees between two different units. In this algebra lesson, students graph linear equations and identify the line of best fit. They use their line of best fit to make predictions given a set of data.
Curated OER
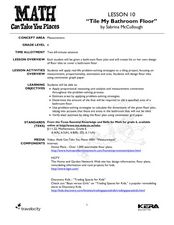
Tile My Bathroom Floor
Seventh graders create a bathroom floor plan using measurement math. In this measurement lesson, 7th graders use measurement, proportionality, estimation, and area to design a floor plan. Students design floor tiles using centimeter...


