Pearson
Performance Based Assessment Practice Test (Algebra II)
A full-length practice test like this one, especially one that includes a number of open response questions, is a phenomenal tool in a class as rigorous as algebra 2. Here the learners can really get that hands-on experience...
Illustrative Mathematics
Mr. Brigg's Class Likes Math
A quick discussion question that brings some collaboration into your classroom will allow your thinkers to make a decision about sampling. Mr. Briggs wants to know if the results from his class are a valuable comparison to the entire...
Illustrative Mathematics
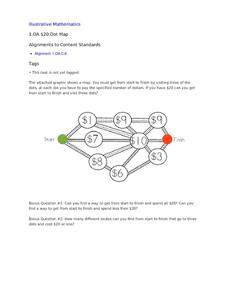
$20 Dot Map
Challenge the addition skills of young learners with this open-ended math problem. The task is simple, get from start to finish by connecting a series of three numbers. The trick is that the sum of the numbers must be less than...
EngageNY
Population Problems
Find the percent of the population that meets the criteria. The 17th segment of a 20-part unit presents problems that involve percents of a population. Pupils use tape diagrams to create equations to find the percents of subgroups...
EngageNY
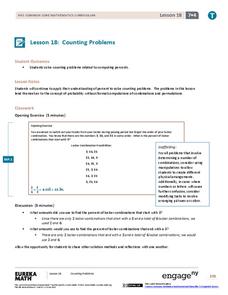
Counting Problems
Solving these percent problems is a matter of counting. Pupils find percents by counting the number of events that meet the criteria and the total number of possibilities. Participants create the ratio and convert it to a percent to...
EngageNY
End-of-Module Assessment Task: Grade 7 Mathematics Module 6
Determine the level of understanding within your classes using a summative assessment. As the final lesson in a 29-part module, the goal is to assess the topics addressed during the unit. Concepts range from linear angle relationships,...
EngageNY
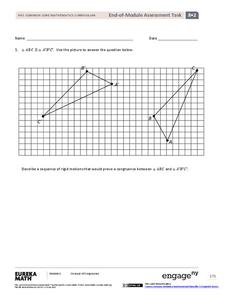
End-of-Module Assessment Task - Grade 8 Mathematics (Module 2)
Can your classes apply the knowledge they have learned? Use this performance task to find out! Individuals use transformations to explain congruence and angle relationships within parallel lines to find missing values. They show what...
Balanced Assessment
Ostrich and Seahorse
Examine the relationship between ratios and scale. Young math scholars compare ratios of two models. They use the ratios to make a comparison between the two models. Each image uses a different scale, which requires learners to think...
Illustrative Mathematics
Ice Cream Van
In an open-ended problem, learners calculate costs involved in driving an ice cream van. Is it better to park in one place or drive through different neighborhoods? Learners look at these and other factors and must make reasonable...
Illustrative Mathematics
Field Day Scarcity
Introduce young mathematicians to concepts of financial literacy with this open-ended word problem. With seven dollars to spend during field day and given a list of available items and their prices, children must determine how they want...
Illustrative Mathematics
Global Positioning System II
Intricate details of a modern technology that many of us take for granted in our phones, computers (and some cars) are laid bare in a short but deeply investigative activity. The math behind a seemingly simple GPS device...
Concord Consortium
Fermi Time
It's all just a matter of time. The resource provides four Fermi questions in reference to time. The questions are open-ended and require classmates to make use of estimation and dimensional analysis.
Illustrative Mathematics
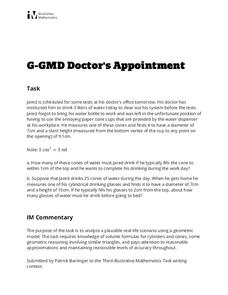
Doctor's Appointment
Geometric volume calculations are brought into the real world in a quick set of application problems. Learners are asked to help a patient figure out how to drink a prescribed amount of water both at work and at home. This activity...
Achieve
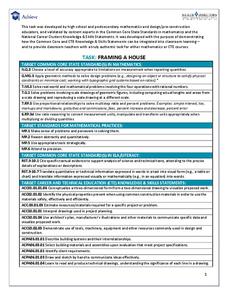
Framing a House
If members of your class wonder where they can use the math they learn in middle school, let them discover the answer. Learners apply geometry concepts of scale and measure to calculate the costs of framing a house addition.
Noyce Foundation
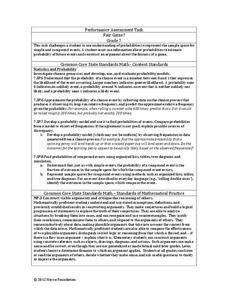
Fair Game?
The game should be fair at all costs. The mini-assessment revolves around the ability to use probabilities to determine whether a game is fair. Individuals determine compound events to calculate simple probabilities and make...
EngageNY
Comparing Distributions
Data distributions can be compared in terms of center, variability, and shape. Two exploratory challenges present data in two different displays to compare. The displays of histograms and box plots require different comparisons based...
EngageNY
Describing Center, Variability, and Shape of a Data Distribution from a Graphical Representation
What is the typical length of a yellow perch? Pupils analyze a histogram of lengths for a sample of yellow perch from the Great Lakes. They determine which measures of center and variability are best to use based upon the shape of the...
Illustrative Mathematics
Sale!
Everyone loves a sale, and this worksheet allows learners to calculate which sale is more rewarding. The activity can be adapted for different thinking contexts. The answer key describes different answer choices, some being higher...
Concord Consortium
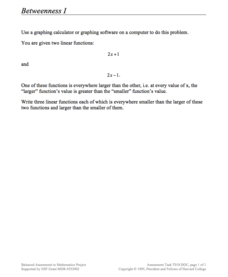
Betweenness I
Just between us, this is a pretty cool lesson! Given two functions with the same slope, learners write three new functions whose outputs are all between the given functions. The question is open-ended, allowing pupils to explore the...
Concord Consortium
Betweenness IV
Challenge your classes to think between the curves. Given two function formed by the combination of two exponential functions, individuals must write three functions in which all values would lie between the given. The question is...
Concord Consortium
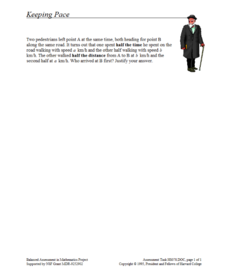
Keeping Pace
What came first, pedestrian one or pedestrian two? Scholars consider a problem scenario in which two people walk at different rates at different times. They must decide who reaches a checkpoint first. Their answers are likely to surprise...
Illustrative Mathematics
Paper Clip
With minimal setup and maximum freedom, young geometers are encouraged to think outside the box on a seemingly simple application problem. Though the task seems simple, measuring a given paper clip and finding how many 10 meters can...
EngageNY
The Relationship of Multiplication and Division
Take any number, multiply it by five, and then divide by five. Did you end up with the original number? In the same vein as the previous lesson, pupils discover the relationship between multiplication and division. They develop the...
Achieve
Fences
Pupils design a fence for a backyard pool. Scholars develop a fence design based on given constraints, determine the amount of material they need, and calculate the cost of the project.


