Newspaper Association of America
Power Pack: Lessons in Civics, Math, and Fine Arts
Newspaper in Education (NIE) Week honors the contributions of the newspaper and is celebrated in the resource within a civics, mathematics, and fine arts setting. The resource represents every grade from 3rd to 12th with questions...
Curated OER
Multiplication Table (10 x 10)
In this multiplication practice worksheet, students use their problem solving skills to fill in the blanks in a 10 x 10 multiplication table.
Curated OER
Third Grade Math Practice
In this math practice worksheet, young scholars complete a total of 20 problems that use a variety of 3rd grade concepts. An answer key is given.
Curated OER
Use or Make a Table
In this use or make a table worksheet, students examine data given in a story problem. They use logic to determine the best way to begin organizing the data and creating a table. This one-page worksheet contains three...
EngageNY
Writing and Evaluating Expressions—Multiplication and Addition
How many people can sit around a table? The 22nd part in a series of 36 continues the work on writing and evaluating expressions to include expressions with two operations. Pupils use models to determine an expression for the number of...
Inside Mathematics
Winning Spinners
Winning a spin game is random chance, right? Pupils create a table to determine the sample space of spinning two spinners. Individuals determine the probability of winning a game and then modify the spinners to increase the probability...
EngageNY
Problems in Mathematical Terms
Whether scholars understand independent and dependent variables depends on you. The 32nd installment of a 36-part series has learners analyze relationships in real-world problems through tables. They determine independent and dependent...
EngageNY
Writing and Evaluating Expressions—Multiplication and Division
Don't table the resource on writing expressions for relationships in tables. Scholars investigate relationships between variables and write algebraic expressions involving multiplication and division. These expressions help solve...
Curated OER
Sunshine Math--3: Mars, II
Students practice solving mathematical word problems. In this math worksheet, they solve one probability problem, write in the missing numbers in a table, solve one mental math problem and interpret two graphs.
Curated OER
Sunshine Math- 1 Venus, III
In this problem solving learning exercise, students complete 7 problems that include: reasoning, basic operations, graphs, tables, geometry and math puzzles.
Curated OER
Sunshine Math- 2 Earth, VII
In this math activity, students solve 8 varied problems that include: making tables, circle graphs, choosing the sign, finding angles in pictures, and estimation.
EngageNY
Chance Experiments with Outcomes That Are Not Equally Likely
The fifth portion of the 25-part series introduces probabilities calculated from outcomes that are not equally likely. Class members use tables to calculate probabilities of events, add outcome's probabilities, and find...
Willow Tree
Linear Relationships
There's just something special about lines in algebra. Introduce your classes to linear equations by analyzing the linear relationship. Young mathematicians use input/output pairs to determine the slope and the slope-intercept formula to...
California Education Partners
Linflower Seeds
How does your garden grow? Use proportions to help Tim answer that question. By using their understanding of proportional relationships, pupils determine the number of seeds that will sprout. They create their own linear...
Charleston School District
Pre-Test Unit 9: Scatter Plots
What do your classes know about statistics? Use a pre-test to determine their background. Topics include scatter plots and lines of best fit, two-way frequency tables, and modeling with linear equations.
Curated OER
Carnival Tickets
A great subtraction and division discovery opportunity for young mathematicians, this learning task involves seven word problems that require multiple steps. Learners use a math table to persevere in solving problems that are...
Curated OER
Using A Table
In this table worksheet, students observe information in a table, and then answer ten questions pertaining to the information. They must correctly read a table in order to arrive at the correct answer. Questions pertain to features of...
Curated OER
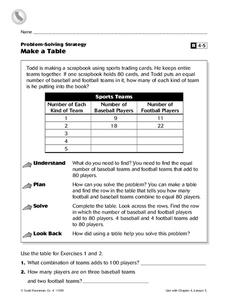
Make a Table
For this charting worksheet, 4th graders complete a table. Using the information provided, students fill in the missing data and complete 2 short answer questions.
Curated OER
Frequency Histograms, Bar Graphs and Tables #3
In this frequency histograms instructional activity, students examine bar graphs, histograms and tables. They identify the model of information that best matches the statistics. This three-page instructional activity cotnains...
Curated OER
Use or Make a Table
In this make a table worksheet, students read real world questions and write an equation to match the equation. Next, they solve the equation. This one-page worksheet contains two problems.
Curated OER
Ratio Tables
In this ratio table activity, students complete ten ratio tables. Students identify three equivalent fractions to equal the value of the given one. This one-page activity contains ten problems.
Curated OER
Data Analysis: Graphs, Charts, Tables, Statistics
In this data analysis worksheet, learners interpret data in 5 problems involving graphs, tables, and scatterplots. Students construct 1 stem and leaf plot and find the mean, median, and mode of a data set.
Curated OER
Tables and xy-Coordinates
Use this graphing functions worksheet to have learners complete four tables and graph the results on the included coordinate grid.
Illustrative Mathematics
Price per Pound and Pounds per Dollar
Help learners understand the concept of unit rate as it is applied to buying beans at a grocery store. The objective is to determine the unit rate in two ways, and then apply each ratio to an additional problem. The attached commentary...
Other popular searches
- Math Tables and Tools
- +Math Tables Tips Tools
- Math Tables Tips Tools
- Math Tables and Graphs
- Making Math Tables
- Input/output Tables Math
- Learning Math Tables
- Math Tables Multiplacation
- Math Tables Multiplication
- Math Tables 3rd Grade
- Math Tables Predict
- Math Tables and Patterns


