Curated OER
Double Bar Graphs (Reteach 15.1)
In this graphs worksheet, students analyze the data on two double bar graphs. Students answer 4 questions about the information on the graphs.
Curated OER
Problem Solving: Use a Table Reteach 16.8
In this problem solving worksheet, students learn to look for information in a data table. Students answer 6 questions about a data table.
Curated OER
Graphing Data
Second graders graph data about their classmates. In this data analysis activity, 2nd graders ask each other several questions about their hair color and eye color. Students graph the data that they collected.
Curated OER
Graphing
Students collect data to create different types of graphs-line, pie, and bar graphs. They use StarOffice 6.0 to create graphs.
Curated OER
Graphing Quadratic Functions
For this graphing quadratic functions worksheet, students create a function table and graph quadratic functions. This four-page worksheet contains 33 problems. A graph is supplied with each function. One example is provided at the...
Curated OER
Graphs and Functions
Middle schoolers describe plotting functions on the Cartesian coordinate plane. They solve functions on paper and using an online tool to plot points on a Cartesian coordinate plane creating lines and parabolas.
Curated OER
Linear Programming
Students explore inequalities to determine the optimal solution to maximize a profit for a company. In this linear programming instructional activity, students discover how to graph inequalities and how to determine the algebraic...
Curated OER
Practice: Word Problems
Congratulations, you've just hit the word problem jackpot! Covering an incredible range of topics from integers and fractions, to percents, geometry, and much more, this collection of worksheets will keep young mathematicians...
EngageNY
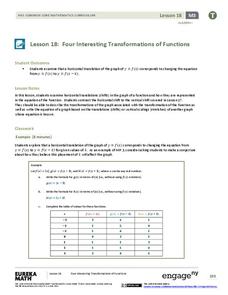
Four Interesting Transformations of Functions (Part 2)
What happens to a function whose graph is translated horizontally? Groups find out as they investigate the effects of addition and subtraction within a function. This nineteenth lesson in a 26-part series focuses on horizontal...
Flipped Math
Unit 1 Review: Analyze Graphs and Expressions
Get in one last practice. Pupils work through 12 problems and a performance task to review the topics in Unit 1. The problems cover analyzing and modeling with graphs, algebraic properties of equality, and adding, subtracting, and...
Virginia Department of Education
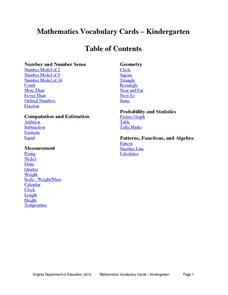
Mathematics Vocabulary Cards - Kindergarten
Enhance your math lesson with a series of pictures that illustrate different math concepts. The vocabulary includes a variety of ideas and pictures including fractions, ordinal numbers, picture graphs, and number lines.
CCSS Math Activities
Smarter Balanced Sample Items: High School Math – Target C
Let units pave the way to success. A set of five questions in a helpful PowerPoint presentation highlights the SBAC Claim 1 Target C high school item specifications. It covers the use of units to steer solutions, identifying appropriate...
Illustrative Mathematics
Fixing the Furnace
This comprehensive resource applies simultaneous equations to a real-life problem. Though the commentary starts with a graph, some home consumers may choose to begin with a table. A graph does aid learners to visualize the shift of one...
Radford University
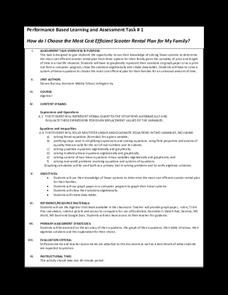
How do I Choose the Most Cost Efficient Scooter Rental Plan for My Family?
Pupils compare the cost of renting scooters for a family vacation from three different rental places. To help make their decision, scholars create tables, equations, and graphs of the pricing structure. Individuals then determine which...
National Research Center for Career and Technical Education
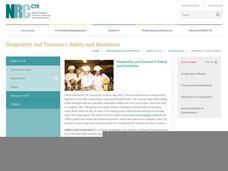
Hospitality and Tourism 1: Safety and Sanitation
Math and science come alive in this career-related lesson plan on sanitation. Along the way, learners explore bacterial growth rates using exponential notation and graphs. A link to a very brief, but vivid video shows just how quickly...
Virginia Department of Education
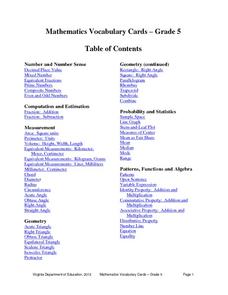
Mathematics Vocabulary Cards - Grade 5
Elevate your fifth graders' understanding of math concepts with a series of vocabulary posters. Featuring terms concerning probability and statistics, measurement, algebra, and decimal place value (and many more), the posters are...
Intel
Choreographing Math
Leaners investigate families of linear functions through dance. They choreograph dance moves to model nine unique linear functions of their choosing. Using their dance moves, teams create a video presentation complete with music and...
Curated OER
Sunshine Math 3
In this word problems worksheet, learners read and problem solve nine mathematical word problems involving grids, measurement, compensation and angles.
US Department of Commerce
Featured Activity: Population Change Over Time
Keep track of a state's population. After a brief discussion on how population data is used for funding, individuals look at population changes over time. Pupils find the population of two states using three different censuses. They then...
EngageNY
Finding One Hundred Percent Given Another Percent
Class members solve problems to find the whole when given a percent. They use double line numbers and factors of hundred to help break the 100 percent into equal segments.
Curated OER
M&M Science and Math
A series of math and science activities feature M&M's® as manipulatives to help kids work through equations. The resource includes exercises on finding averages, percent of compositions, moles in chemical reactions, genotypes and...
Pingry School
Gas Pressure and Volume Relationship
Do your high school scientists know the four methods scientists use to communicate information? A simple experiment discovering the relationship between gas pressure and volume allows pupils to practice all four. After completing the...
Open Text Book Store
Arithmetic for College Students: Worksheets
Loaded with concepts ranging from multiplying decimals to converting units to solving problems using the order of operations, a thorough practice packet is perfect for a fifth or sixth grade math classroom.
Curated OER
Graphing Linear Functions Two
Use this graphing linear functions worksheet to have learners graph three linear equations. They use a table of values, the intercept method, and slope-intercept form to graph three functions.


