Scholastic
Test-Taking Strategies for Three Subject Areas
Sometimes a test page loaded with text can make a student's face go blank. Help them decipher what a text question is asking with a series of tips focused on reading comprehension, vocabulary, and language arts mechanics.
Virginia Department of Education
Analyzing and Interpreting Statistics
Use measures of variance to compare and analyze data sets. Pupils match histograms of data sets to their respective statistical measures. They then use calculated statistics to further analyze groups of data and use the results to make...
Virginia Department of Education
Logic and Conditional Statements
If there is a conditional statement, then there is a hypothesis and conclusion. Pupils learn how to identify the parts of conditional statements. Class members continue to work with conditional statements and rewrite them in their many...
EngageNY
The Relationship Between Visual Fraction Models and Equations
Ours is to wonder why, not just to invert and multiply. The seventh installment of a 21-part module uses fraction models to help pupils understand why the invert-and-multiply strategy for dividing fractions works. They then work on some...
Kenan Fellows
Let's Move
Find a statistical reason for a fresh start. Using a hypothetical scenario, individuals research statistical data of three different cities. Their goal? Find the best statistical reason for a business to move to a new location. Their...
Curated OER
How Many Letters Are In Your Name?
Students discover how to make a graph that represents the number of letters in their names. In this early childhood math lesson plan, students collect data, categorize data, and develop skills to analyze the pieces of data.
EngageNY
Motion Along a Line – Search Robots Again
We can mathematically model the path of a robot. Learners use parametric equations to find the location of a robot at a given time. They compare the paths of multiple robots looking for parallel and perpendicular relationships and...
EngageNY
Rotations, Reflections, and Symmetry
Lead your high school class on a journey through the world of symmetry and reflections as you discuss geometric principles. Pupils differentiate between reflections and rotations, explore rotational symmetry, and investigate how to...
EngageNY
Making Scale Drawings Using the Ratio Method
Is that drawn to scale? Capture the artistry of geometry using the ratio method to create dilations. Mathematicians use a center and ratio to create a scaled drawing. They then use a ruler and protractor to verify measurements.
EngageNY
The Side-Angle-Side (SAS) and Side-Side-Side (SSS) Criteria for Two Triangles to Be Similar
Playing with mathematics can invoke curiosity and excitement. As pupils construct triangles with given criteria, they determine the necessary requirements to support similarity. After determining the criteria, they practice...
EngageNY
A Focus on Square Roots
Pupils learn to solve square root equations and rationalize denominators. Problems include those with extraneous solutions.
EngageNY
Awkward! Who Chose the Number 360, Anyway?
Don't give your classes the third degree. Use radians instead! While working with degrees, learners find that they are not efficient and explore radians as an alternative. They convert between the two measures and use radians with the...
EngageNY
Calculating Conditional Probabilities and Evaluating Independence Using Two-Way Tables (part 2)
Without data, all you are is another person with an opinion. Show learners the power of statistics and probability in making conclusions and predictions. Using two-way frequency tables, learners determine independence by analyzing...
EngageNY
Margin of Error When Estimating a Population Proportion (part 1)
Use the power of mathematics to find the number of red chips in a bag — it's a little like magic! The activity asks learners to collect data to determine the percentage of red chips in a bag. They calculate the margin of error and...
EngageNY
Margin of Error When Estimating a Population Mean (part 2)
Don't leave your classes vulnerable in their calculations! Help them understand the importance of calculating a margin of error to represent the variability in their sample mean.
EngageNY
Ruling Out Chance (part 3)
Pupils analyze group data to identify significant differences. They use simulation to create their own random assignment data for comparison.
EngageNY
The Graph of a Function
Mathematics set notation can be represented through a computer program loop. Making the connection to a computer program loop helps pupils see the process that set notation describes. The activity allows for different types domain and...
West Contra Costa Unified School District
Key Features of Graphs
The key is ... After a day of instruction on key features of graphs, groups create a poster and presentation on the key features of their given function graph. The resource provides an extension activity of "telephone" using...
Virginia Department of Education
Quadratic Equations
Review the multiple methods of solving quadratic equations through an analysis of the discriminant. Scholars use the discriminant to determine the best solution method and then solve various equations. As a challenge, learners build...
Curated OER
Middle Grades Math: Balancing Equations
Learners solve linear equations. By observing the graph of each side of an equation using the TI-nspire graphing calculator, your class gains insight into solutions, as well as balancing equations and transforming linear equations....
Ohio Department of Education
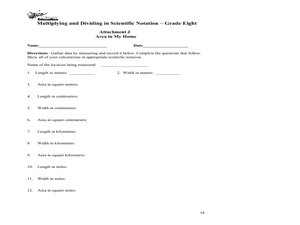
Multiplying and Dividing in Scientific Notation - Grade 8
Here is really nice set of resources on scientific notation. Eighth and ninth graders explore the concept of multiplying and dividing in scientific notation. In this multiplying and dividing numbers in scientific notation...
Illustrative Mathematics
Size Shuffle
In the eyes of children the world is a simple place, objects are either big or small. This simple activity aims to expand the comparison language of young mathematicians as they use the words taller and shorter to compare their...
Cornell University
Math Is Malleable?
Learn about polymers while playing with shrinky dinks. Young scholars create a shrinky dink design, bake it, and then record the area, volume, and thickness over time. They model the data using a graph and highlight the key features of...
Curated OER
The Math in the Design and Building of Bridges
Research various types of bridge designs. Your class will be asked to consider what it would be like without bridges while learning about how they work. They will construct a model bridge based on given parameters. They then calculate...


