Bowland
Public Transport
"Statistics is the grammar of science" -Karl Pearson. In the assessment task, learners read a claim made by a newspaper and analyze its conclusions. They need to think about the sample and the wording of the given statistics.
Worksheet Place
How I Get to School
Find out how many of your learners take the bus, how many walk, and how many bike with a quick survey. Class members gather data about how each individual gets to school and mark the results on this page in order to create a bar graph.
Beyond Benign
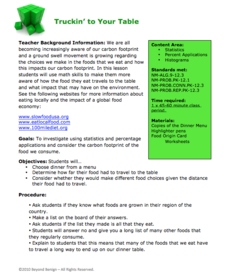
Truckin’ to Your Table
Food takes a trip to the table. Class members choose a meal from a menu and calculate the total cost of the meal including tax and tip. Using a food origin card, pupils determine how far each of the ingredients of a meal traveled to end...
NASA
Ascent: 50 Seconds to MECO
All systems go! With a video and a Google Earth tour as background, pairs investigate two graphs. The graphs display acceleration vs. time and velocity vs. time of a space shuttle launch. Using graphing calculators, the pairs take a...
Cmassengale
Photosynthesis Diagrams Worksheet
Help young botanists get to the root of photosynthesis with this series of worksheets. By completing these diagrams, students demonstrate their understanding of the biological structures and chemical reactions that make this amazing...
Curated OER
Como llegas a la escuela?
What is the most popular way to get to school? Have students interview their peers to discover how and when they get to school. Then learners will graph the results. Consider providing statistics from other classes for your older...
Teach Engineering
Cost Comparisons
Our final proposal for the cost of the bridge requested is ... In the last segment in a series of 10, pairs work together to develop a proposal for a city bridge design. The class completes a cost comparison between concrete and steel to...
EngageNY
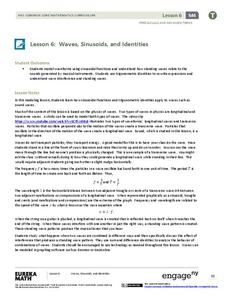
Waves, Sinusoids, and Identities
What is the net effect when two waves interfere with each other? The lesson plan answers this question by helping the class visualize waves through graphing. Pupils graph individual waves and determine the effect of the interference...
Mathematics Assessment Project
Taxi Cabs
A simple real-world problem involving taxi cab fares is used to practice the multplicaiton and division of integers. How many of two different-sized taxis are needed to transport 75 people to the airport? What is the least expensive...
Bowland
Taxi Cabs
Determine the cheapest way to the airport. Pupils read a scenario about trying to get 75 people to the airport using two different sizes of taxis. Learners calculate the number of smaller taxis needed given a number of large taxis and...
Texas State Energy Conservation Office
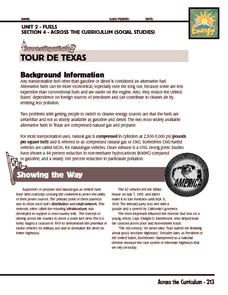
Investigation: Tour de Texas
Teams of Texas tourists gather into groups to analyze what they can do with $50 worth of an alternative fuel. They write checks, keep a balance sheet, and map out their sight-seeing route taking into consideration the location of...
Concord Consortium
School Bus Routes
Plan the way to school. Given a map of a school district, class members portray a transportation consultant hired to develop a bus transportation plan that will pick up the eligible riders and get them to school. The plan must contain...
It's About Time
Petroleum and Your Community
I was going to write a joke about oil, but it seemed crude. This lesson starts with a comparison of where the US gets oil from and how that has changed over time. After analyzing the data, scholars create a graph and use the Internet to...
Beyond Benign
Ecological Footprint
How does your lifestyle measure up in terms of your ecological footprint? Young ecologists examine their impact on the planet using an insightful online calculator. A short quiz asks users to rank the size of their homes, their energy...
Curated OER
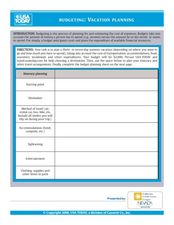
Budgeting: Vacation Planning
For this vacation planning worksheet, students plan a vacation. They determine the approximate cost of their vacation. Students complete an itenrary and graphic organizer to identify daily costs of the vacation. This two-page...
Curated OER
Multiplication and Division
In this multiplication and division worksheet, students fill in the blank to solve multiplication and division problems. They write combinations of numbers to equal a specified product or quotient. Students solve division problems with...
Curated OER
Practice With Decimals
In this decimal worksheet, students solve decimal problems, estimating, balancing a checkbook, and finding the cost of a car using a given chart.
Teach Engineering
Archimedes' Principle, Pascal's Law and Bernoulli's Principle
What do Pascal's law, Archimedes' Principle, and Bernoulli's Principle have to do with fluid mechanics? The included PowerPoint presentation provides the basic definitions and equations associated with the three. A set of homework...
Curated OER
Brain Teaser - Holidays
In this logic learning exercise, students solve a word problem using logic about holiday destinations and method of transportation for traveling. Students complete 1 problem.
Curated OER
Find The Odd One Out
In this categorization worksheet, students examine 4 transportation pictures and identify the picture that is different from the others.
Curated OER
Statistical Diagrams
In this statistics worksheet, students explore five activities that require analysis and interpretation of maps, charts, and scatter plots. The six page lesson includes five activities or experiments with short answer questions. ...
Curated OER
Adding in the Garden
In this adding with picture clues worksheet, students write the missing number in each of 8 number sentences. All numbers will be below 5.
Curated OER
Adding Two- and Three-Digit Numbers
In this adding two- and three-digit numbers worksheet, young scholars, with a partner, problem solve and calculate the answers to eight mathematical word problems and equations.
Curated OER
Sky High Fuel
In this fuel price worksheet, students examine a chart that shows fuel prices between 2001 and 2005. They compute the answers to 3 word problems in which they work with finding average. They complete an extension activity in which they...


