Texas State Energy Conservation Office
Investigation: Blowing in the Wind
Using a simulated air sample, environmental or earth science pupils examine the components. You will need to prepare the faux air by using a hole punch and various colors of construction paper. Each color will represent a different...
Creative Chemistry
Comparing the Degree of Unsaturation of Margarine with that of Butter
Is butter better? In terms of saturation, young chemists find out! Using titration methods, they will compare the degree of saturation of butter with that of margarine. Knowing the unsaturation, they can make conclusions about the...
Virginia Department of Education
Organizing Topic: Data Analysis
Learners engage in six activities to lead them through the process of conducting a thorough analysis of data. Pupils work with calculating standard deviations and z-scores, finding the area under a normal curve, and sampling...
Curated OER
Conductivity - Pass the Buoy and Pepper, Please
Buoys around our coastlines are equipped with sensory devices which monitor temperature, salinity, and water pressure. Emerging earth scientists examine some of this data and relate salinity to the electrical conductivity of the surface...
Teach Engineering
Bridge Types: Tensile and Compressive Forces
Bridges rely on tension and compression to keep them standing. Pairs test this principle by constructing simple bridges and applying a force to the center. Teams use the provided worksheet to record their observations of the...
Royal Society of Chemistry
Green Plastics—Chemistry Outreach
How do green plastics reduce waste and environmental pollution? Budding scientists create and test a variety of compounds used in green plastics during an insightful experiment. Beginning with startling statistics and ending with...
Curated OER
Swirling and Churning Milk
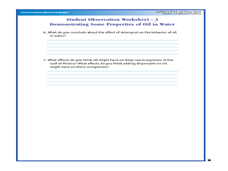
Students examine the concepts of micelles, polarity, solubility, and properties of detergent in an experiment with milk, water, and food coloring. Students complete a Take-Home Challenge in which they experiment with the behavior of food...
Curated OER
Oil Floats, Right?
Learners examine the properties in oil in water. In this mixture lesson, students read about the Lophelia II 2010: Cold Seeps and Deep Reef Expedition and look at images of deep sea ecosystems. They experiment or participate in...
Curated OER
Create Your Own Form
Students gather and organize data using a mock census form, and determine mean, mode, range, and median for sets of data.
Curated OER
Parts-Per-Million Concentration Lab
Students develop a comprehension of parts per million as a concept. They work in teams to create successive dilutions of a solution to reach a parts-per-million concentration. Students list what they think the atmosphere is made of. They...
Curated OER
Poetic Math Greeting Cards
Fourth graders work in groups; collect data in a survey; depict in tables, charts, or graphs the results of the survey; and make predictions. They use creative writing skills and computer skills to generate a greeting card of their own.
Curated OER
Rain On
Fourth graders study the water cycle and clouds. In this water cycle and cloud lesson, 4th graders determine the definition of condensation and watch a demonstration in which the teacher makes a cloud in a bottle. They discuss the water...
Curated OER
Light
Students examine how light waves travel. For this properties of light lesson, students observe how light travels in water, how light is reflected and refracted, and how light is pure energy.
Curated OER
Vegetable Olympics Shot Put
Students explore the distribution of plant seeds. In this science instructional activity, students discuss plants that explode in order to spread their seeds. Students create pea shooters and use dried peas to see how far they will travel.
Curated OER
Technology vs. Nontechnology
Fourth graders determine the range, mean, median and mode using a computer spreadsheet. An identical set of calculations is done without using a computer. The results of each method are compared. They calculate the mode, median and range...
Curated OER
Lyrics Statistics
Students describe, analyze and generalize relationships, patterns, functions using words. symbols, variables, tables and graphs.
Curated OER
Herschel Infrared Experiment
Students perform a version of the experiment of 1800 by the famous astronomer Sir Frederick William Herschel.
Curated OER
Taste the Rainbow
Young scholars practice estimating and graphing by utilizing Skittles. In this statistics instructional activity, students complete worksheets based on the likelihood of a certain color of skittle coming out of the bag. Young...
Curated OER
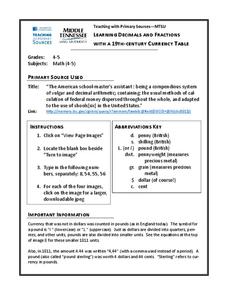
Decimals and Fractions
Young scholars learn about using decimals and fractions by referring to a 19th century currency table. In this decimals and fractions lesson plan, students discuss converting pounds to coins and how they relate to fractions and decimals.
Curated OER
Who Are You Calling a Yob?
Learners examine anti-social behavior issues. In this current events lesson, students discover the attributes of Asbos and discuss the controversial use of Asbos by British police agencies.
Curated OER
Build An Island
Students explore erosion. In this science lesson plan, students build an island and observe the effects of erosion on the island. Students discuss freshwater ecosystems in Hawaii.
Curated OER
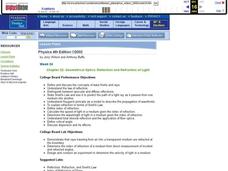
Geometrical Optics: Reflection and Refraction of Light
Students define and discus the concepts of wave fronts and rays. In groups, they distinguish between specular and diffuse reflections and use Snell's Law to predict the path of light rays. They calculate the speed of light through...
Curated OER
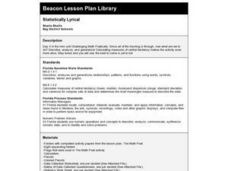
Statistically Lyrical
Students examine and discuss the writing of ratios as fractions and where they can be found in the real world. They complete worksheets and a questionnaire, and calculate the mean, median, and mode scores for the class.
Curated OER
Central Tendencies and Normal Distribution Curve
Fourth graders are given data (class test scores) to determine central tendencies, and find information needed to construct a normal distribution curve. They become proficient in calculating mode, median and average.


