Shodor Education Foundation
Stem and Leaf Plotter
The key is in the leaves. Pupils enter data to create a stem-and-leaf plot. The resource then displays the plot and calculates the mean, median, and mode of the data. Using the plot and the calculated measures of spread, learners analyze...
Goodwill Community Foundation, Inc.
Transportation
Are you going on a trip? ¿Cómo estás viajando? Whether Spanish learners are taking el avión, el autobus, or el tren, they'll know how to describe and pronounce their modes of transportation with an interactive Spanish resource.
Curriculum Corner
Measures of Central Tendency
Reinforce the concept of central tendency—mean, median, mode, and range—with a practice packet that comprises of eight problems and a structured answer sheet with plenty of room to show work.
Education Development Center
Creating Data Sets from Statistical Measures
Explore the measures of central tendency through a challenging task. Given values for the mean, median, mode, and range, collaborative groups create a set of data that would produce those values. They then critique other answers and...
Curated OER
Mean Meadian and Mode
Students apply central tendencies to given data. In this statistics lesson, students calculate the mean, median, and mode as it relates to their data. They collect data and graph it while identifying the way the numbers are ordered.
Curated OER
Range and Mode problem solving 4.5
For this finding range and mode word problem worksheet, learners use a number line showing data to solve word problems. Students draw or write to explain and solve four problems.
Curated OER
Mean Median and Mode
Students collect data, graph it and analyze it. In this statistics lesson plan, students plot their data and calculate the mean, median and mode explaining how it relates to the data. They define the ways to find the mean, median and mode.
Curated OER
Atlatl Lessons Grades 4-12: Lesson for Beginning Users of Atlatl
Sixth graders determine the mean, range median and mode of a set of numbers and display them. In this data instructional activity students form a set of data and use computer spreadsheet to display the information. They extend of...
Curated OER
Find the Range #2
In this finding the range worksheet, students find the mean, median, mode, and range of each of six number sets. They write the answers in the boxes next to each label.
Curated OER
Find the Range #5
In this mathematics worksheet, students view 6 different sets of numbers. Students, for each set of numbers, find the mean, mode, median and range. Students place their answers in the boxes provided.
Curated OER
Shedding Light on the Weather with Relative Humidity
Learners study weather using a graphing calculator in this instructional activity. They collect data for temperature and relative humidity for every hour over a day from the newspaper, then place the data in their handheld calculator and...
PhET
Balancing Chemical Equations
Just like the old saying goes, "What goes in must come out." This simulation allows pupils to balance chemical equations. The introduction gives three examples before scholars switch to game mode, pick their level, and continue to...
PhET
Beer's Law Lab
Beer's Law can be used to measure the concentration of certain compounds in samples of food. In the concentration simulation, particpants change and measure the concentration of different solutions by manipulating various types of...
Curated OER
Batter Up! Math Stations
Math stations that review important concepts with the real-world example of baseball.
Curated OER
Averages: Computing Mean, Mode and Median
Seventh graders use daily temperature models to find the mean, mode and median.
Curated OER
Computing Mean, Mode and Median
Ninth graders collect data on basketball player's heights and determine the mean, median, and mode for the data.
Curated OER
Mean, Median, Mode, and Range: Practice
In this line plots worksheet, students make a line plot for each set of data and identify any clusters or gaps. Students then find the mean, median, mode, and range for the first four problems. Students then find n using the given mean,...
Curated OER
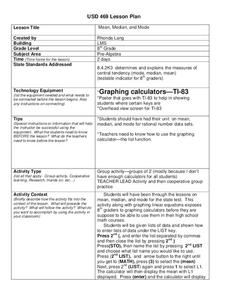
Mean, Median, and Mode
Eighth graders practice using the LIST key on graphing calculators using the proper syntax. They work with the functions of mean, median, and mode in a teacher led instructional activity and then with a partner on a second data set. They...
Curated OER
Collect, organize and compare different data for the Marine Mammals of the Miami Seaquarium, i.e.: size, weight, diet and habitat and how to calculate average, median, mode and range.
Young scholars collect, organize, and compare different data and develop statistical methods such as: average, median, mode and range as a way for decision making by constructing table
Curated OER
Range and Mode
In this range and mode activity, students read the math word problems and the numbers within the problem to help find the range and mode for each problem.
Curated OER
Mean, Median, and Mode
Fourth graders compare two sets of data by using a double bar graph. In this data analysis lesson plan, 4th graders study a double bar graph and complete questions based upon the data. Students construct a table to show the data from the...
Centre for Innovation in Mathematics Teaching
Ten Data Analysis Activities
This thirteen page data analysis worksheet contains a number of interesting problems regarding statistics. The activities cover the concepts of average measurements, standard deviation, box and whisker plots, quartiles, frequency...
Curated OER
Math Games for Upper Elementary Students
Keeping skills sharp doesn't have to be a chore. It can be done with math games.
Curated OER
Pick A Number
Elementary schoolers find out which month has the most class birthdays (mode) and which birthday represents the middle point of all the birthdays (median). They gather and organize data to find one number that fairly represents the whole...
Other popular searches
- Mean, Median, Mode
- Modern
- Modern Dance
- Mean Median Mode
- Modern Art
- Array Model of Multiplication
- Bohr Model
- Modes of Transportation
- Dna Models
- Graphing Mean, Median, Mode
- Free Mean, Median, Mode
- Math; Mean, Median, Mode


