Curated OER
Habitat for Plants! There's No Place Like Home!
Learners compare and contrast conditions necessary for survival of aquatic and terrestrial plants, identify common and scientific names of plants,
and determine correlation between location and plant characteristics. Students then use...
Curated OER
Lines of Fit
Students graph an equation and analyze the data. In this algebra lesson, students graph scatter plots and identify the line of best fit using positive correlation, negative correlation an d no correlation. They apply their data analysis...
Curated OER
Lines of Fit
Students graph an equation and analyze the data. For this algebra lesson, students graph scatter plots and identify the line of best fit using positive correlation, negative correlation an d no correlation. They apply their data analysis...
Curated OER
Lines of Fit
Learners solve equations dealing with best fit lines. In this algebra lesson, students solve problems by analyzing data from a scatterplot, and define it as positive, negative or no correlation. They classify slopes the same way as...
Curated OER
Scatterplots
Students evaluate equations and identify graphs. In this statistics lesson, students identify plotted points on a coordinate plane as having a positive, negative or no correlation. They complete basic surveys, plot their results and...
Curated OER
The Frog Experiment
Your science class reads a silly story in which a mad scientist makes absurd conclusions about an experiment that he conducted. One at a time, he cuts off a frog's leg and commands it to jump. With three, two, and one leg, the frog...
Curated OER
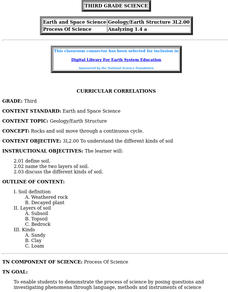
Curricular Correlations
An interesting instructional activity on different types of soils is here for you. In it, learners discuss what soil is, and consider three piles of soil - clay, sand, and loam. During the rest of the instructional activity, third...
Mascil Project
Sports Physiology and Statistics
If I want to build up my heart, where should I start? Science scholars use statistics in a sports physiology setting during an insightful experiment. Groups measure resting and active heart rates and develop a scatter plot that shows the...
Curated OER
College or Bust?
Based on a New York Times article, "The College Drop-Out Boom," participants in a fishbowl discussion formulate and express opinions about the correlation between level of education, career options, and economic mobility. Ample...
US Department of Energy
Thermodynamics—Teacher Guide
I'm so cool! No, you're exothermic. This thermodynamics lab unit includes an introduction, teacher demonstrations, six labs that students rotate through each class day, homework assignments, application of knowledge, and assessments....
West Contra Costa Unified School District
Families of Functions Sort
Have some fun with functions with a short activity that asks learners to first sort scatter plot in terms of their correlation. They then sort graphs of different types of functions in terms of key features, such as slope.
BW Walch
Creating and Graphing Linear Equations in Two Variables
This detailed presentation starts with a review of using key components to graph a line. It then quickly moves into new territory of taking these important parts and teasing them out of a word problem. Special care is taken to discuss...
Teach Engineering
Equal and Opposite Thrust in Aircraft: You're a Pushover!
It's the law—every action requires a reaction, no matter how small. Pupils experience two demonstrations of Newton's third law of motion as it relates to thrust in the 10th segment of a 22-part unit on flight. Using their mathematical...
Teach Engineering
Solar Angles and Tracking Systems
The sun will continue to rise in the east and set in the west, no matter what. The first lesson in a series of eight introduces the class to solar angles. It makes connections between a person's latitude and the angle of position of the...
Shodor Education Foundation
Multiple Linear Regression
You'll have no regrets when you use the perfect lesson to teach regression! An interactive resource has individuals manipulate the slope and y-intercept of a line to match a set of data. Learners practice data sets with both positive and...
National Research Center for Career and Technical Education
Lou-Vee-Air Car
Who said teaching a STEM lesson had to be challenging? Incorporate a career and technology-centered car build into your upcoming force lesson plan, and your class will be moving down the road in no time! Pupils practice...
Institute for Humane Education
I've Been Branded!
How many pairs of Nikes® or Apple® products are in the average American home? What makes someone buy one particular type of laundry detergent over another? Scholars grapple with these questions as they develop a list of brands they use...
Curated OER
Human Body Series - Respiratory System
Elementary schoolers play a respiratory relay toss in order to take in the respiratory system! They also create their own question cards based on several kid-friendly online articles about breathing and the health of the lungs. They use...
Curated OER
Line Best Fit
Students identify the line of best fit. In this statistics lesson plan, students analyze graphs and plots to identify positive, negative or no correlation. They find the line of best fit for different scatter plots.
Curated OER
Logarithmic Transformations of Data
Students investigate and study logarithmic equations. In this precalculus lesson plan, students analyze the data behind the function. They define each graph as positive, negative or no correlation. They find the line of best fit.
Curated OER
Looking Normal
Young scholars identify the shape of a function. In this statistics lesson, students plot the data collected. They analyze their data for positive, negative or no correlation. They find the line of best fit.
Curated OER
From Playing with Electronics to Data Analysis
Pupils collect and Analyze data. In this statistics lesson, students identify the line of best fit of the graph. They classify lines as having positive, negative and no correlation.
Curated OER
Visual Communication of Quantative Data
Learners collect and analyze data based on academic performance. In this statistics instructional activity, students create graphs and analyze the data they created. They use positive, negative and no correlation to analyze the data.
Curated OER
Word Problems-No Problem!
Third graders create and solve story problems using drawing and presentation software. Working in small groups, 3rd graders create illustrated presentation slides using multiplication facts. As a class, all group multiplication problems...


