EngageNY
Graphs of Simple Nonlinear Functions
Time to move on to nonlinear functions. Scholars create input/output tables and use these to graph simple nonlinear functions. They calculate rates of change to distinguish between linear and nonlinear functions.
EngageNY
Nonlinear Models in a Data Context
How well does your garden grow? Model the growth of dahlias with nonlinear functions. In the lesson, scholars build on their understanding of mathematical models with nonlinear models. They look at dahlias growing in compost and...
EngageNY
The Computation of the Slope of a Non-Vertical Line
Determine the slope when the unit rate is difficult to see. The 17th part of a 33-part series presents a situation that calls for a method to calculate the slope for any two points. It provides examples when the slope is hard to...
Consumers Energy
The Cost of Electricity
How much is your toaster costing you every day? Young environmentalists calculate the monetary costs of household appliances based on their average consumption of wattage.
Virginia Department of Education
Nonlinear Systems of Equations
Explore nonlinear systems through graphs and algebra. High schoolers begin by examining the different types of quadratic functions and their possible intersections. They then use algebraic methods to solve systems containing various...
EngageNY
Identifying Proportional and Non-Proportional Relationships in Tables
Learners determine whether there is a constant multiple within the table through an instructional activity that presents a method for determining whether two quantities are proportional. Pupils analyze tables to determine if they...
Techbridge Curriculum
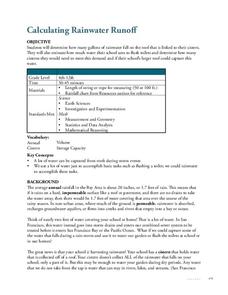
Calculating Rainwater Runoff
Thirsty plants soak up every bit of a rainfall, but what happens to the rain that hits the roof? Calculate the amount of rainwater from your school's roof with an Earth science activity, which brings measurement skills, observation...
EngageNY
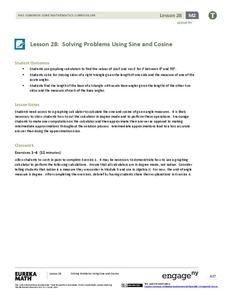
Solving Problems Using Sine and Cosine
Concepts are only valuable if they are applicable. An informative resource uses concepts developed in lessons 26 and 27 in a 36-part series. Scholars write equations and solve for missing side lengths for given right triangles....
EngageNY
The Slope of a Non-Vertical Line
This lesson plan introduces the idea of slope and defines it as a numerical measurement of the steepness of a line. Pupils then use the definition to compare lines, find positive and negative slopes, and notice their definition holds for...
American Statistical Association
What Fits?
The bounce of a golf ball changes the result in golf, mini golf—and a great math activity. Scholars graph the height of golf ball bounces before finding a line of best fit. They analyze their own data and the results of others to better...
Curated OER
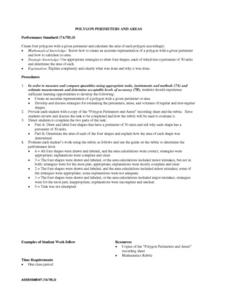
Calculating Perimeter and Area of Polygons
Students discuss strategies for estimating information about various shapes. Once they draw and label four shapes with perimeters of 30 units, they calculate the areas of the figures. To complete the lesson, students offer written...
Curated OER
Can You Measure Up?
Here is a well-designed lesson on common standards of measurement for your young mathematicians. In it, learners calculate measurements in standard and non-standard units. They make predictions, record data, and construct and design...
Curated OER
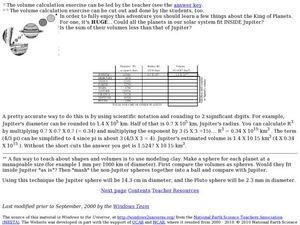
Volume Calculation Exercise
Middle schoolers work with scientific notation and rounding as they determine volume. In this volume instructional activity, pupils attempt to calculate the volume of the planet Jupiter. They use rounding to two significant digits and...
Illustrative Mathematics
Games at Recess
A great non-calculation problem that lets your math minds explore without the pressure of the right answer. Your learners will have to compare boys and girls playing soccer and jump rope during recess. How many more boys than girls are...
Curated OER
Interpreting Graphs
Sixth graders interpret linear and nonlinear graphs. They create graphs based on a problem set. Next, they represent quantitive relationships on a graph and write a story related to graphing.
Curated OER
Mathematical Modeling
Study various types of mathematical models in this math lesson. Learners calculate the slope to determine the risk in a situation described. They respond to a number of questions and analyze their statistical data. Then, they determine...
02 x 02 Worksheets
Inverse Variation
Discover an inverse variation pattern. A simple lesson plan design allows learners to explore a nonlinear pattern. Scholars analyze a distance, speed, and time relationship through tables and graphs. Eventually, they write an equation to...
Curated OER
Energy Conservation
Students investigate energy conservation. In this energy conservation and analyzing data lesson, students identify and explain several energy sources and research renewable and nonrenewable energy sources. Students use statistics...
Curated OER
How do living and non-living structures affect coral reef habitats?
Students create model coral reefs showing surface area and including examples of communities. In this coral reef lesson, students research and explore the functions or benefits from a coral reef. Students design a benthic...
Mathematics Assessment Project
Calculating Volumes of Compound Objects
After determining the volume of various drinking glasses , class members evaluate sample responses to the same task to identify errors in reasoning.
Mathematics Assessment Project
Calculating Arcs and Areas of Sectors of Circles
Going around in circles trying to find a resource on sectors of circles? Here is an activity where pupils first complete an assessment task to determine the areas and perimeters of sectors of circles. They then participate in an...
Curated OER
A Special Relationship
Students discover the relationships of the lengths of the sides of right triangles and right triangles using a series of drawings on dot paper. They investigate and solve problems of standard (customary and metric units) and non-standard...
Texas Instruments
Is It or Isn't It Proportional
How can you tell if number relationships are proportional? Mathematicians investigate proportional relationships. They compare and contrast functions and graphs to determine the characteristics of proportional relationships, as well as...
California Academy of Science
How Big is Big?
In a math or life science class, "mini-me" models are created with cardstock to reflect a 1:10 scale of students' bodies. Learners measure each others' heights with meter sticks, and then reduce the size by 10. After this exercise, they...


