Texas Instruments
2B or not 2B a Functions
Learners use their graphing calculators to view graphs of equations. They tell if each equations is or is not a function and are shown pre-set graphs on their graphing calculators. They use the Quick Poll feature to indicate if the graph...
Curated OER
The Fractal Coast
Students investigate measuring as it relates to the real world. In this geometry lesson, students measure distances as they discuss fractals and how it relates to measuring. They measure both linear and non-linear distances.
EngageNY
The Computation of the Slope of a Non-Vertical Line
Determine the slope when the unit rate is difficult to see. The 17th part of a 33-part series presents a situation that calls for a method to calculate the slope for any two points. It provides examples when the slope is hard to...
EngageNY
Graphs of Quadratic Functions
How high is too high for a belly flop? Learners analyze data to model the world record belly flop using a quadratic equation. They create a graph and analyze the key features and apply them to the context of the video.
Curated OER
Impossible Graphs
Students practice plotting functions on the Cartesian coordinate plane while participating in a discussion about the Possible Or Not worksheet/activity. Students also use the Impossible Graphs worksheet to practice reading a graph,...
Curated OER
Numerical Analysis: Systems of Linear Equations
In this linear equation worksheet, students use the iterative method to solve systems of equations. Explanations and examples are provided. This four-page worksheet contains approximately three problems.
Curated OER
Linear Equations
In this algebra worksheet, student linear equations through addition, subtraction, multiplication and division. They check their work algebraically. There are 26 problems.
Curated OER
Sondheim: Secret Metaphors
Students explore the work of Stephen Sondheim. In this musical theater lesson plan, students examine the musicals Merrily We Roll Along and Sunday in the Park with George. Students identify and anaylze linear and nonlinear structural...
Curated OER
Reductions of Order
In this calculus worksheet, students identify functions as linear or nonlinear, homogeneous versus nonhomogeneous by using the reduction power theorem. There are 5 questions.
Curated OER
What's My Pattern?
Students recognize, describe and extend patterns in three activities. They organize data, find patterns and describe the rule for the pattern as well as use the graphing calculator to graph the data to make and test predictions. In the...
EngageNY
The Slope of a Non-Vertical Line
This lesson introduces the idea of slope and defines it as a numerical measurement of the steepness of a line. Pupils then use the definition to compare lines, find positive and negative slopes, and notice their definition holds for...
EngageNY
Mid-Module Assessment Task: Grade 8 Module 6
Make sure pupils have the skills to move on to the second half of the module with a mid-module assessment task. The formative assessment instrument checks student learning before moving on to the rest of the lessons in the unit.
Houghton Mifflin Harcourt
Unit 4 Math Vocabulary Cards (Grade 6)
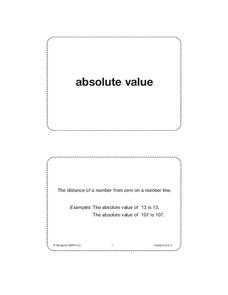
Reinforce math vocabulary with a set of flash cards. Forty-eight cards offer boldly printed words, and their corresponding definition alongside an example with labels. Terms include absolute value, inverse operations, slope, and more!
Curated OER
Comparing Value for Money: Baseball Jerseys
Learners step up to the plate as they first complete an assessment task using linear equations to determine the best company from which to buy baseball jerseys. They then evaluate provided sample responses identifying strengths and...
West Contra Costa Unified School District
Polynomial Division
How do you apply the traditional division algorithm to polynomials? Here is an Algebra II activity that extends the use of the division algorithm to polynomials. After establishing the concept of long division, synthetic division and the...
Mathematics Assessment Project
Matching Situations, Graphs and Linear Equations
What do guitars, candles, and helicopters have in common? They're all in this resource. Learners complete an assessment task to determine the amount of profit made in a guitar class based on given information regarding variable...
Curated OER
Solving Linear Equations
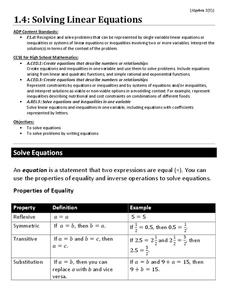
Use this activity for practice or review solving linear equations in one variable. Problems range from multiple-step problems involving parentheses and combining like terms, to word problems, to equations with no solution or infinitely...
Concord Consortium
The Line and the Ellipse
What do a line and an ellipse have in common? Maybe zero, one, or two points! Learners consider the equation of an ellipse and a line to determine if their graphs have any shared points. They then write a system of equations, including...
Curated OER
Very Varied - Inverse variation
Students identify inverse variations. In this inverse variation lesson, students explore graphs and identify the inverse variation. They write equations for the inverse variation. Students compare and contrast the inverse variation...
Illustrative Mathematics
Oakland Coliseum
Help algebra learners relate a real-life function that happens at the Oakland Coliseum every time the Raiders play. The resource states that the revenue of the Oakland Raiders home games is a function of the number of seats sold and the...
Texas Instruments
Let's Play Ball with Families of Graphs
Learners explore quadratic equations in this Algebra II lesson. They investigate families of quadratic functions by graphing the parent function and family members on the same graph. Additionally, they write the equation of the parabola...
Curated OER
Walk the Line
Learners create constant speed versus motion graphs. They will perform linear regressions on their data to describe the graphs mathematically.
Curated OER
Lessen the Loan
Middle-schoolers explore the concept linear equations. They use the internet to navigate through videos and problems. Pupils problem solve to determine rates of change, slope, and x and y-intercepts.
Curated OER
Direct and Inverse Variation
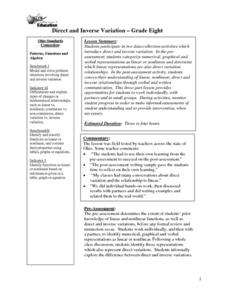
Eighth graders participate in two data collection activities that involve direct and inverse variation. In the pre-assessment, 8th graders categorize numerical, graphical, and verbal representations as linear or nonlinear and determine...


