Curated OER
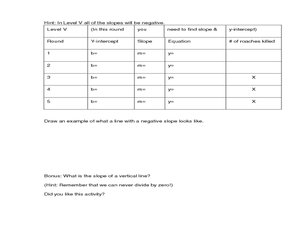
Cockroach Slope
Students identify the slope of linear functions. In this slope lesson, students collect data and graph it. They write equations with no more than two variables and use technology to explain their data.
Curated OER
Pollution Assessment: Is Wood Lake a Good Lake?
Young scholars become aware of pollution in Richfield Minnesota's Wood Lake, identify sources of pollution in Wood Lake, learn to use variables, equations, spreadsheets and modeling software, and generate solutions for the problem.
Curated OER
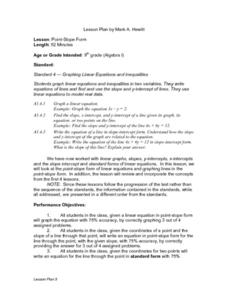
Point-Slope Form
Ninth graders explore the point-slope form of linear equations and graph lines in the point-slope form. After completing the point-slope equation, they identify the slope of a line through a particular point. Students explain the...
Curated OER
Standard Linear Form
Ninth graders identify and describe the x-intercept as the place where the line crosses the x-axis as it applies to football. They create their own differentiations to reinforce the distinction between the x-intercept and the...
Curated OER
How Old Did You Say?
Second graders explore and develop algebraic formulas based on their own ages as the known variable. This is a clever, and simple, way to introduce the concept of algebra to young students.
Inside Mathematics
Graphs (2006)
When told to describe a line, do your pupils list its color, length, and which side is high or low? Use a worksheet that engages scholars to properly label line graphs. It then requests two applied reasoning answers.
EngageNY
Modeling Linear Relationships
Math modeling is made easy with the first installment of a 16-part module that teaches pupils to model real-world situations as linear relationships. They create graphs, tables of values, and equations given verbal descriptions.
Curated OER
Left Hand, Right Hand - Solving Systems of Equations
Students compare the speed at which they write with their left hand to the speed at which they write with their right hand. The experiment serves as a vehicle to help students develop a conceptual understanding of the three different...
Curated OER
Graphing Linear Equations Using Data Tables
Pupils review the Cartesian plane and the process of plotting points. In groups, students create tables, identify the slope and y-intercept, and graph the equation. Afterward, pupils perform the same process, only, individually. As a...
Curated OER
Linear Systems: Least Squares Approximations
In this least squares approximation worksheet, students determine the number of solutions a given linear system has. They find the least square error and the equation of a line of best fit for a set of three points. Students find the...
Curated OER
Linear Systems: Least Squares Approximations
In this least squares approximation worksheet, learners use linear algebra to find the least square error and the equation of a line for given points. They find the equation of a parabola through provided points. This four-page...
Curated OER
Interpreting Graphs
In this algebra learning exercise, students interpret graphs using given data and information. They are asked to relate real world scenario using algebraic equations. There are 31 questions with a variety of topics being covered.
Curated OER
Making Money and Spreading the Flu!
Paper folding, flu spreading in a school, bacteria growth, and continuously compounded interest all provide excellent models to study exponential functions. This is a comprehensive resource that looks at many different aspects of these...
Mascil Project
Sports Physiology and Statistics
If I want to build up my heart, where should I start? Science scholars use statistics in a sports physiology setting during an insightful experiment. Groups measure resting and active heart rates and develop a scatter plot that shows the...
Curated OER
Calculating Range for a Constant Velocity
Learners read an explanation from the NASA Web-based "textbook", The Beginner's Guide to Aerodynamics, then use the information in combination with data from other Web sites to solve single variable equations for distance (range), time,...
Inside Mathematics
Quadratic (2009)
Functions require an input in order to get an output, which explains why the answer always has at least two parts. After only three multi-part questions, the teacher can analyze pupils' strengths and weaknesses when it comes to quadratic...
02 x 02 Worksheets
Inverse Variation
Discover an inverse variation pattern. A simple lesson plan design allows learners to explore a nonlinear pattern. Scholars analyze a distance, speed, and time relationship through tables and graphs. Eventually, they write an equation to...
Curated OER
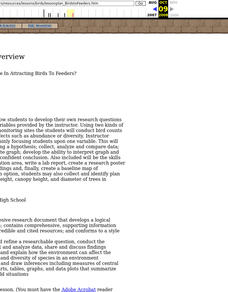
What Factors Contribute In Attracting Birds To Feeders?
Students develop their own research questions dealing with specific variables provided by the instructor; students conduct bird counts using two kinds of birdseed, and analyze possible effects such as abundance or diversity.
Noyce Foundation
Boxes
Teach your class to think outside the box. Scholars use the concept of equality to solve a problem in the assessment task. They determine how to use a scale to identify the one box out of a set of nine boxes that is heavier than the others.
Curated OER
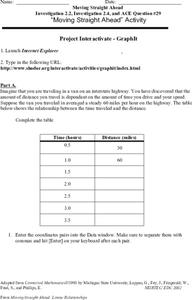
Moving Straight Ahead
In this functions worksheet, 9th graders solve and complete 24 various types of problems. First, they complete the table with the correct distance for each hour given. Then, students enter the coordinate pairs into the function table...
Curated OER
Analyzing Birds and Planes
Students find a variety of topics and subjects in this lesson. In the math section of this lesson, students graph linear equations and analyze their data. They solve one and two step equations to find the variable.
Curated OER
The Demise of Copper's Trading Power
Eighth graders evaluate statistical equations. They examine data from archaeologists at Jamestown, complete statistical equations using the sets of data, and graph the results.
Curated OER
Can you Find the Expression
Young scholars collect data from measurements and weights for this experiment. In this algebra lesson, students analyze graphs they create form their data to find the expression representing the data. They label which graph provided the...
Curated OER
Virtual Field Trip: Lodging and Meals
Students calculate the costs for lodging and meals for a virtual field trip. They calculate the number of nights lodging needed for road and city travel and the number of meals needed, the costs for each, and input the data using...


