Curated OER
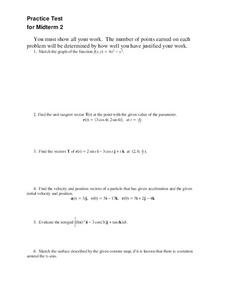
Math 53 - Review for Midterm 1
In this review for midterm, students use parametric equations to find points on a curve, explore conic sections, write vector functions, and sketch cylindrical coordinates. This two-page review contains 10 multi-step problems.
Curated OER
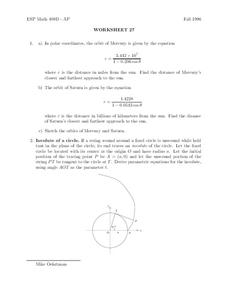
Worksheet 27
In this math learning exercise, students examine the equations for the planets of Mercury and Saturn. Then they find the distance of Saturn’s closest and farthest approach to the sun.
Curated OER
Mobile vs. Money
Students research the internet and use the information they find to plot straight line graphs. They use graphs to make comparisons of the various packages offered. Students interpret graphs and solve problems based on varying parameters.
Curated OER
Worksheet 22 - Spring 1996
students examine the potential of creating the involute for a circle. They use the concept to create new parametric equations. They graph the picture for each.
Curated OER
Vectors
For this vectors worksheet, students solve and complete 6 various types of problems. First, they find two unit vectors that are parallel to the given vector and illustrate. Then, students find parametric equations for the line that...
Teach Engineering
Quantifying Refraction
Class members discover how mathematics can quantify the behavior of light waves with the fourth installment of a seven-part series that teaches future engineers about equations related to refraction, including the equation to calculate...
Illustrative Mathematics
Baseball Cards
Here is a resource that demonstrates growth and the initial state of an equation. In this case, your class will be looking at baseball collections. How many baseball cards did the collector start out with, and how many were added or...
Curated OER
Length of an Arc
Students compute the length of an arc and each hypotenuse in the give figure, adding them up in the end. They then develop the formula for the arc length with respect to the x-axis and the y-axis. Students also develop a formula for the...
Curated OER
The Lift Equation
Students use the FoilSim educational software program to complete an activity regarding lift. They solve a multivariable equation for each of the variables and apply the results to various problems in different situations.
Curated OER
Showing the Lift Equation
Pupils read an explanation from a NASA Web-based textbook, then demonstrate an understanding of the text by using it, along with FoilSim, to complete an activity that manipulates the lift coefficient equation.
Mathematics Assessment Project
Modeling Motion: Rolling Cups
Connect the size of a rolling cup to the size of circle it makes. Pupils view videos of cups of different sizes rolling in a circle. Using the videos and additional data, they attempt to determine a relationship between cup measurements...
Curated OER
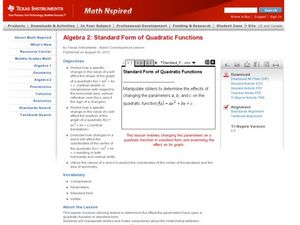
Standard Form of Quadratic Functions
Learners factor quadratic equations. In this algebra lesson, students identify the factors and use them to graph the parabola. They find the parameters and vertex of each graph.
American Chemical Society
Controlling the Amount of Products in a Chemical Reaction
Everyone enjoys combining baking soda and water. Here is a lesson that challenges scholars to analyze the reaction three different ways — the real substances, the chemical equation, and the molecular models. Class members experiment to...
Curated OER
Correlation of Variables by Graphing
Middle and high schoolers use a spreadsheet to graph data. In this graphing lesson, learners determine how two parameters are correlated. They create a scatter plot graph using a computer spreadsheet.
Curated OER
Wrapping It All Up
Through learning how to examine linear, quadratic, and exponential functions, students explore the effects of changes in parameters on the graphs of linear, quadratic, and exponential functions. The lesson is designed to be a review of...
Curated OER
Zeros of a Quadratic Function
Factor quadratic equations by teaching your students how to identify the zeros of the quadratic function. They use the TI to see where the graph will intercept the coordinate plane.
College Board
2007 AP® Calculus BC Free-Response Questions Form B
There is just a single real-world problem. Released free-response items from the 2007 AP® Calculus BC Form B contains only one real-world question. The question involves rate of change of wind chill scenario. The mathematical problems...
Curated OER
Application of Graph Theory
Students investigate different online tutorials as they study graphing. For this graphing lesson, students apply the concept of graphs cross curricular and use it to make predictions. They define the purpose and theories behind graphs.
Curated OER
Quadratic Function Investigations
Learners perform investigation of quadratic functions while taking part in the solving of various types of problems. They explore the changes in the coefficients on the quadratic function to observe the patterns. The lesson includes...
NASA
Lost in Space: Bone Density
If you don't use it, you lose it. Groups work together to compare bone loss on Earth as opposed to bone loss in space. They determine the equations that model bone loss and make calculations to determine the amount of bone loss for...
PBS
Garden Grade 6 Area and Perimeter
Engage young mathematicians in applying their knowledge of area and perimeter with a fun geometry lesson plan. Through a series of problem solving exercises, children use their math knowledge to design different-sized garden plots that...
EngageNY
Modeling with Polynomials—An Introduction (part 2)
Linear, quadratic, and now cubic functions can model real-life patterns. High schoolers create cubic regression equations to model different scenarios. They then use the regression equations to make predictions.
West Contra Costa Unified School District
Correlation and Line of Best Fit
Computers are useful for more than just surfing the Internet. Pupils first investigate scatter plots and estimate correlation coefficients. Next, they use Microsoft Excel to create scatter plots and determine correlation coefficients and...
Teach Engineering
Discovering Relationships Between Side Length and Area
Consider the relationship between side length and area as an input-output function. Scholars create input-output tables for the area of squares to determine an equation in the first installment of a three-part unit. Ditto for the area of...


