National Council of Teachers of Mathematics
Eruptions: Old Faithful Geyser
How long do we have to wait? Given several days of times between eruptions of Old Faithful, learners create a graphical representation for two days. Groups combine their data to determine an appropriate wait time between eruptions.
Exploratorium
Jacques Cousteau in Seashells
Visionaries create images out of dots to demonstrate the eye-brain connection. Through this activity, they learn that the brain interprets data collected by the eye into recognizable information. Search online for "Jacques Cousteau in...
Howard Hughes Medical Institute
Seed Dispersal in Tropical Forests
How do seeds get around? It's not like plants can control seed dispersal—or can they? Dig deeper into the amazing mechanisms of seed dispersal observed in tropical plants through interactives, a video, and plenty of hands-on data...
Curated OER
Music and Sports
With so much talent in the classroom, do your musicians and athletes have related interests? This problem has your learners taking data from their classmates to decide whether there is an association between the two activities. The...
Curated OER
Dice Games
Games and activities are wonderful for igniting interest in nearly any topic. With a pair of dice, your class will practice their basic math and social skills at the same time. Learners battle it out to see who can roll only odds or only...
US Environmental Protection Agency
Weather and Climate: What's the Difference?
Future weather forecasters collect daily temperatures over a period of time. Afterward, they compare their data with monthly averages, as researched on national weather websites, in order to grasp the difference between weather and...
Museum of Science
Weather Station
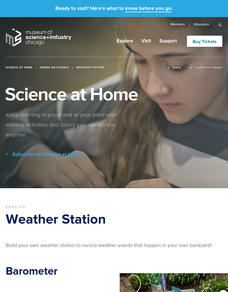
Find out what it is like outside before braving the elements. Teachers follow directions to build a barometer, rain gauge, and anemometer. Class members use the built weather instruments along with a thermometer to record weather...
101 Questions
Tether Ball
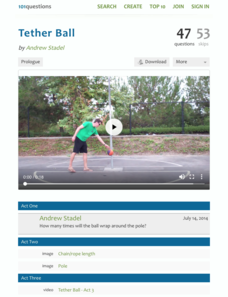
All work and no play makes for a boring classroom! Bring back memories by analyzing the patterns of a tether ball. Given the dimensions of the ball, pole, and rope, young scholars must determine how many times the ball will wrap around...
Teach Engineering
Earthquakes Living Lab: Locating Earthquakes
There are patterns in nearly everything — even earthquakes. Pairs research current earthquakes to see if there are any patterns. They determine the mean, median, and mode of the earthquake data, along with the maximum and...
US Environmental Protection Agency
Tree Rings: Living Records of Climate
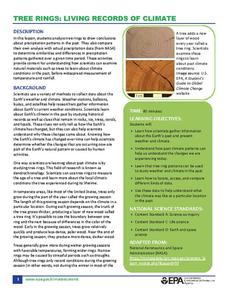
Open with a discussion on weather and climate and then explain how tree rings can provide scientists with information about the earth's past climate. Pupils analyze graphics of simulated tree rings from various US locations for the...
University of Wisconsin
Follow the Drop
Young surveyors look for patterns in water flow around campus. Using a map of the school (that you will need to create), they mark the direction of the path of water. They also perform calculations for the volume that becomes runoff. The...
Howard Hughes Medical Institute
Virus Hunters: Epidemiology of Nipah Virus
Who actually goes looking for a virus? Expose your class to the high-stakes life of an epidemiologist on the trail of the Nipah virus. Pupils engage in a short video, then examine how scientists predict, model, and find the source of...
Curated OER
Lyrics Statistics
Students describe, analyze and generalize relationships, patterns, functions using words. symbols, variables, tables and graphs.
101 Questions
Coins in a Circle
Round and round you'll go! Learners watch as different-sized circles fill with coins. They collect data and then make a prediction about the number of coins that will fit in a large circular rug.
NASA
Benford's Law
In this Benford's Law learning exercise, high schoolers read about the first digit frequency of numbers. Students solve 3 problems about sunspot numbers, solar wind magnetism and the depth of the latest earthquakes by using on line sites...
Spartan Guides
Infographics Lesson
An infographic is fantastic way for learners to illustrate their understanding of content, express themselves creatively, and teach others in a manner that is both engaging and informative. While originally designed for a lesson on...
Tennessee Technical University
Carousel Brainstorm
A variation of the Walkabout Review process, carousel brainstorming directs groups to rotate through a series of stations posting ideas on the topic or question posted at each stop.
American Museum of Natural History
Make Your Own Weather Station
Scholars build a weather station equipped with a wind vane, rain gauge, and barometer. Following an informative page about the weather, learners follow steps to build their pieces then turn into meteorologists to chart the weather they...
Center for Learning in Action
Properties of Balls
Enhance your states of matter lessons with a hands-on science investigation that compares six different balls' color, texture, size, weight, ability to bounce, and buoyancy.
National Council of Teachers of Mathematics
Nctm: Figure This: Do Women Live Longer Than Men?
Use this site to figure out if women really do live longer than men. A math challenge taken from today's health journals that explores data collection, data analysis, patterns, and graphing skills. Learn how mastering these skills can be...
Texas Instruments
Texas Instruments: Bounce Back: The Exponential Pattern of Rebound Heights
In this activity, students' will use a motion detector to collect motion data for a bouncing ball. They will then analyze the data to test the exponential model of motion.
Texas Instruments
Texas Instruments: Pass the Ball
In this activity, students use mathematics to examine patterns that occur in a specific scenario and predict future events for the scenario. Data is collected on the time it takes to pass a ball. The students plot graphs, fit the data...
Cyberbee
Cyberbee: Who Dunnit?
If you are a crime scene investigation (CSI) fan, then you will love this site! You get to be the detective by examining the evidence, viewing the crime scene, dusting for fingerprints, interviewing the suspects, and solving the crime.
Rice University
Rice University: The Hand Squeeze
Students will enjoy this data collection and class analysis experiment involving the time it takes for a hand squeeze to travel around a circle of people. From organizing the activity to collecting the data to making a table and graphing...


