Bowland
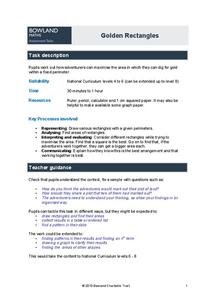
Golden Rectangles
Scholars must determine the maximum area for a rectangular plot of land enclosed with 100 meters of rope. As the work they discover patterns and numerical approaches to solve the problem.
EngageNY
The Mean as a Balance Point
It's a balancing act! Pupils balance pennies on a ruler to create a physical representation of a dot plot. The scholars then find the distances of the data points from the balance point, the mean.
Curated OER
Statistics
Seventh and eighth graders solve and complete three various types of problems. First, they find the median rate using the box-and-whisker plot shown. Then, learners describe the inter-quartile range. In addition, they determine whether...
EngageNY
From Ratio Tables, Equations and Double Number Line Diagrams to Plots on the Coordinate Plane
Represent ratios using a variety of methods. Classmates combine the representations of ratios previously learned with the coordinate plane. Using ratio tables, equations, double number lines, and ordered pairs to represent...
GeoGebra
Leaping Lizards
Transform lizards onto different locations. The interactive provides a diagram of a lizard and several locations. Pupils use their knowledge of transformations to move the lizard to the different locations and use the tools of GeoGebra...
Curated OER
Statistical Inquiry
In this statistical inquiry instructional activity, students analyze and interpret a variety of diagrams such as a scatter plot, bar graph and pie charts. They create tables and other diagrams to support given data. This two-page...
Curated OER
Integrated Algebra
In this integrated algebra worksheet, students solve problems covering topics studied during the year. Problems include topics such as slope-intercept, Venn Diagrams, finding the solution to multi-step algebra problems, writing...
Curated OER
Data Handling
For this data handling worksheet, students explore multiple ways to represent data. They create stem and leaf plots, histograms, and bar charts. Students examine and interpret diagrams and statistics. This eleven-page worksheet...
Curated OER
Statistical Calculations Using M&Ms
In this frequency learning exercise, students investigate, frequency, box plots, and percentage using a package of M&Ms. Copies of the actual correspondences with the Mars company are also included.
Curated OER
Statistical Diagrams
In this statistics worksheet, students explore five activities that require analysis and interpretation of maps, charts, and scatter plots. The six page lesson includes five activities or experiments with short answer questions. ...
CCSS Math Activities
Smarter Balanced Sample Items: High School Math – Target P
Learn how to show data in varied ways. A PowerPoint presentation provides six questions from the high school SBAC Claim 1 Target P item specifications. It covers creating data representations, interpreting and comparing data, and...
Curated OER
LRO and the Apollo-11 Landing Site
In this Apollo-11 landing site worksheet, students read about the NASA Lunar Reconnaissance Orbiter (LRO) that will collect images at a higher resolution than ever before. Students study a grid showing the lunar landing site from Apollo...
Houghton Mifflin Harcourt
Unit 8 Math Vocabulary Cards (Grade 4)
Enhance fourth graders' math vocabulary with 17 word cards and their definitions. Learners focus on terms that deal with graphing, such as y-axis, coordinates, plot, and ordered pair in the last set of math vocabulary cards.
Curated OER
Rescue Mission Game
Students conduct probability experiments. For this rescue mission lesson, sudents play a game and collect statistical data. They organize and interpret the data and determine the probability of success. Students plot points on a...
Curated OER
Modeling the Electromagnetic Spectrum
Learners construct a model of an electromagnetic spectrum using play-doh and string. They use exponents and plot the radio/microwave, infrared, and visible bandwidths of the spectrum.
Curated OER
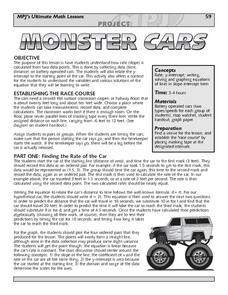
Monster Cars: Slope
Students examine how a rate is calculated from two points. Using battery operated cars, pairs of students measure time and distance. Afterward, they use this data to calculate the rate. Students then plot four ordered pairs and discover...
California Education Partners
Animals of Rhomaar
Investigate the growth rates of alien animals. Pupils study fictional animals from another planet to determine how much they grow per year. The investigators plot the growth of their animals over a period of time and then compare them to...
Curated OER
Histograms and Statistical Graphics
In this statistics worksheet, students solve 6 data problems. They construct a histogram of given data, they create a frequency polygon, and a stem and leaf diagram. Students create a dot plot and a pie chart for given data sets. On the...
Curated OER
Plotting Points
In this middle school mathematics/Algebra I worksheet, students plot points on a coordinate plane. The one page worksheet contains six problems. Answers are not provided.
Curated OER
Identify and Graph Linear Equations
Students investigate linear functions. In this mathematics lesson plan, students plot points onto a graph by solving the equations y=x and y=mx+b by being given numbers for x and solving for y.
Houghton Mifflin Harcourt
Unit 3 Math Vocabulary Cards (Grade 5)
Fifty-four flashcards make up a set to help reinforce math vocabulary. The set offers two types of cards; a word card printed in bold font, and a definition card equipped with an example and labels. Terms include capacity, histogram,...
Curriculum Corner
8th Grade Math "I Can" Statement Posters
Clarify the Common Core standards for your eighth grade mathematicians with this series of classroom displays. By rewriting each standard as an achievable "I can" statement, these posters give students clear goals to work toward...
California Education Partners
Science Fair Project
Plant the data firmly on the graph. Given information about the growth rate of plants, pupils determine the heights at specific times and graph the data. Using the information, scholars determine whether a statement is true and support...
Curriculum Corner
8th Grade Math Common Core Checklist
Ensure your eighth graders get the most out of their math education with this series of Common Core checklists. Rewriting each standard as an "I can" statement, this resource helps teachers keep a record of when each standard was taught,...
Other popular searches
- Short Story Plot Diagram
- Creation Myth Plot Diagram
- Plot Diagram the Outsiders
- Blank Story Plot Diagram
- Julius Caesar Plot Diagram
- Plot Diagram for Fiction
- Free Story Plot Diagram
- Creating Plot Diagram
- Story Plot Diagram Steps
- Folktale Story Plot Diagram
- Plot Diagram for Stories
- Story Plot Diagram Samples


