University of Wisconsin
What’s a Square Foot Anyway? Laying Out the Design Plan
Clever! Participants don square-foot cardboard shoes to mark out the rain garden plot that they have spent the last few weeks designing. In this way, they are practicing scale modeling as well! Note that this activity is part of a unit,...
Curated OER
Using Coordinate Geometry by Land, Sea and Outer Space.
Students complete a table of values and plot points, as well as construct a graph on a coordinate grid. They construct two graphs on the same coordinate system, and identify the point of intersection. Students represent and record...
Curated OER
Coordinate Planes
Identifying the location of ordered pairs on coordinate planes is the focus in the math lesson presented here. In it, 4th graders are introduced to coordinate pairs, the x/y axis, and the techniques associated with this type of graphing....
Curated OER
Ocean Waves and Tides
In this tides learning exercise, students will use a tide chart to plot 15 data points onto a graph. Students will be looking at high tides and low tides and comparing the ranges. This learning exercise has 2 short answer questions.
Houghton Mifflin Harcourt
Unit 8 Math Vocabulary Cards (Grade 4)
Enhance fourth graders' math vocabulary with 17 word cards and their definitions. Learners focus on terms that deal with graphing, such as y-axis, coordinates, plot, and ordered pair in the last set of math vocabulary cards.
Curated OER
Unit 5: Worksheet 4 - Proportions
In this proportion worksheet, learners use proportions to find the missing side of similar triangles, they identify the percent of a number, and graph points on a coordinate plane. Students solve real life story problems dealing with...
Curated OER
Properties of Curves
In this Calculus instructional activity, students use a graphing calculator to boost their understanding of functions and their graphs as they examine the properties of curves. The forty-two page instructional activity contains one...
Curated OER
Connecting Algebra and Geometry Through Coordinates
This unit on connecting algebra and geometry covers a number of topics including worksheets on the distance formula, finding the perimeter and area of polynomials, the slope formula, parallel and perpendicular lines, parallelograms,...
Curated OER
Separate Vacations
High schoolers plot the migration paths of birds using latitude and longitude data from a table.
Bytes Arithmetic
Geometry Pad+
Graphing paper, pencil, ruler, protractor, and compass, all get replaced or supplemented with this dynamic geometry application. Here, you can create, move, and scale many different shapes, as well as, explore and change their properties...
Curated OER
Exponential Functions
With this two-page resource, learners evaluate and graph exponential functions. There are 48 questions using logs and exponents as the parent function.
Curated OER
Coordinate Geometry
Grab your class and get them graphing polygons on a coordinate plane! They investigate the four quadrants, discover the x and y axis, and correctly plot ordered pairs. To show their comprehension, each child creates a coordinate picture...
Noyce Foundation
Snail Pace
Slow and steady wins the race? In the assessment task, scholars calculate the rates at which different snails travel in order to find the fastest snail. Hopefully, your class will move much more quickly in finishing the task!
Curated OER
Plugging Into The Best Price
Examine data and graph solutions on a coordinate plane with this algebra lesson. Young problem-solvers identify the effect of the slope on the steepness of the line. They use the TI to graph and analyze linear equations.
Curated OER
Saving the Bald Eagle
Students plot on a coordinate plane. In this algebra lesson, students identify points on a coordinate plane and graph lines given coordinate pairs. They create a model as they study bald eagles and their growth and decay.
Curated OER
Eye Color
Students take a survey on eye color and plot their findings into a graph. In this eye color lesson plan, students take a class survey of everyone's eye color and learn how to put those findings into a graph.
Curated OER
How Creepy!
Young scholars observe and measure a model of slow down slope movement. In this graphing lesson students collect, record, and organize data that apply to models.
Curated OER
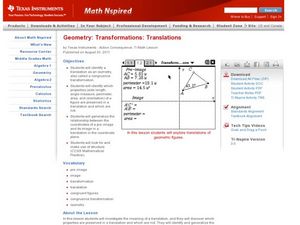
Transformations-Translations
Young scholars perform transformations and translation on a coordinate plane. In this geometry lesson, students move shapes around on a graph identifying translation, image, and transformation. This lesson has an interactive part online...
Curated OER
Comparing and Ordering Integers
Students compare and order integers on an umber line. In this algebra lesson, students differentiate between positive and negative numbers. They plot point in the correct order on a number line.
Polar Trec
Temperature Profile above the South Pole
Collecting and understanding data is a big part of understanding the world and how it changes. To better grasp what temperatures are changing and how they affect global populations, learners create a graph based on the date provided....
Curated OER
Famous People: Student Worksheet
Older learners consider a list of famous people, and they fill in two columns; one in which they guess the celebrities' ages, and another where they look up their actual age. They construct a graph by assigning one of the columns...
Curated OER
Snow Cover by Latitude
Students create graphs showing the amount of snow coverage at various points of latitude and compare graphs.
Curated OER
Real World Investigation- Math and Geography- Elevation Changes
For this math and geography real world investigation, 6th graders plan a driving trip to a city that is located several states away from their home while recording the elevations of three cities that are included in the trip. They use...
Statistics Education Web
Sampling in Archaeology
Compare different random sampling types using an archaeological setting. Scholars collect data from an archaeological plot using simple random samples, stratified random samples, systematic random samples, and cluster random samples....


