Education World
The African American Population in US History
How has the African American population changed over the years? Learners use charts, statistical data, and maps to see how populations in African American communities have changed since the 1860s. Activity modifications are included to...
University of Richmond
Foreign-Born Population 1850-2010
If America is a nation of immigrants, where are they from and why did they come? Demographic data and interactive maps help pupils consider answers to these questions by examining the statistics of foreign-born Americans. Features allow...
Population Connection
Where Do We Grow from Here?
Did you know that the population is expected to grow to 11 billion by 2100? The resource serves final installment in a six-part series on the global population and its effects. Scholars interpret data from the United Nations about the...
Delegation of the European Union to the United States
The Geography of Europe
What is the European Union? Where is it? Why is it? To begin a study of the EU, class members examine the physical geography of Europe and the size and population density of 28-member countries in comparison to non-member countries...
Concord Consortium
Center of Population
Let the resource take center stage in a lesson on population density. Scholars use provided historical data on the center of the US population to see how it shifted over time. They plot the data on a spreadsheet to look the speed of its...
Curated OER
A World of Information
Students analyze data and statistics about countries around the world. They read graphs and charts, color a world map to illustrate the top ten statistics about the world, and write a paragraph to summarize their information.
College Board
2017 AP® Human Geography Free-Response Questions
How have urban planners tried to attract people to cities? What can be done about booming birth rates in some parts of the world? How does a country's political structure affect the well being of its people? Scholars investigate these...
Curated OER
Big Dam Construction in India
This complete and full resource includes everything needed to conduct a lesson plan on the environmental impact of large dams in India. Background information, handouts, answer keys, and web links are all there to help you educate your...
Curated OER
Charts, Maps, and Graphs Lesson on the Holocaust
Young scholars practice interpreting data. In this Holocaust lesson, students research selected Internet sources and examine charts, maps, and graphs regarding the Jewish populations in and out of Europe. Young scholars respond to...
Curated OER
US City Quality of Life Analysis and Comparison
Students analyze US census data and criteria to compare and measure the quality of life in the country's fifty largest cities. After accessing the 2005 quality of life world report online, students conduct their study to compare three...
Curated OER
Little House in the Census: Almanzo and Laura Ingalls Wilder
How would you use census data from 1880-1900? Here are a set of ways you can incorporate the book Little House on the Prairie and US census data from that time period. Learners will research the validity or the book based on factual...
Curated OER
Population Pyramids
Students explain the significance of population trends on world regions. They define relevant population vocabulary and examine age-gender patterns at various scales.
Curated OER
Lesson 1: Map Data and the Census
Young scholars learn about the history of the census. In this U. S. Census lesson plan, students develop an understanding about how the United States Constitution grants and distributes power and discover how the spatial organization of...
Howard Hughes Medical Institute
Patterns in the Distribution of Lactase Persistence
We all drink milk as babies, so why can't we all drink it as adults? Examine the trend in lactase production on the world-wide scale as science scholars analyze and interpret data. Groups create pie charts from the data, place them on a...
Curated OER
Great Lakes Homepage for Kids
Here are some outstanding lessons on the geology and history of the Great Lakes. These lessons are divided into Grade 4 -6, and Grade 7 - 8 activities. The activities all use the background information, maps, graphs, data, and Great...
Population Connection
A Demographically Divided World
Did you know that birth and life rates vary across the world? The resource, the second in a six-part series, discusses just how demographics differ across countries and why it might be the case. Scholars complete worksheets, watch...
Curated OER
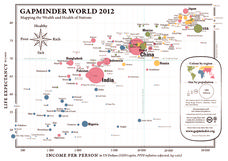
Gapminder World 2012
Here is a very interesting infographic that compares the average life expectancies, per capita incomes, and population sizes of every country in the world in 2012.
Curated OER
Whoa! Slow Down-Some of You!
Students analyze demographic data (growth rate, natural increase, fertility rate, crude birth rates, and crude death rates) and determine which areas of the world contain the fastest and slowest growth rates. They construct population...
Curated OER
Race and Ethnicity in the United States
Students explore race and ethnicity as it is defined by the U. S. Census Bureau. They compare data from 1900, 1950, and 2000 and identify settlement patterns and changes in population. In groups, they map these changes and discuss...
Curated OER
World Cities of 5 Million or More
Students consult online resources to identify and map the world's largest cities and metropolitan areas. They analyze birth rates, settlement patterns and other demographic data and make predictions for the future. They write essays...
Curated OER
Where Should We Put a Store?
Students analyze population data. They convert population data into simple density maps to help make decisions about their world. They select the best location for a school store based on population density. They present their maps...
Curated OER
Exploring the USA and the World with Cartograms
Learners investigate cartograms in order to explore the different countries on Earth. In this world geography lesson, students use the Internet to analyze data on different cartograms. Learners compare data, such as population density,...
Curated OER
Hurricanes and Climate
Students investigate maps and data to learn about the connections between hurricanes and climate. In this exploratory lesson plan students describe and graph the 6 regions where hurricanes happen and discuss how hurricanes have changed...
Curated OER
Population and Air Pollution
Students conduct Internet research to compare the impact of increasing populations and how it affects air pollution in both, the USA and Russia. Students present their finding in a creative manner by developing brochures, bumper...


