Delegation of the European Union to the United States
The Geography of Europe
What is the European Union? Where is it? Why is it? To begin a study of the EU, class members examine the physical geography of Europe and the size and population density of 28-member countries in comparison to non-member countries...
Education World
The African American Population in US History
How has the African American population changed over the years? Learners use charts, statistical data, and maps to see how populations in African American communities have changed since the 1860s. Activity modifications are included to...
Curated OER
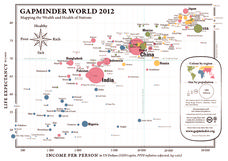
Gapminder World 2012
Here is a very interesting infographic that compares the average life expectancies, per capita incomes, and population sizes of every country in the world in 2012.
Curated OER
Population Pyramids
Students explain the significance of population trends on world regions. They define relevant population vocabulary and examine age-gender patterns at various scales.
School Improvement in Maryland
Demographic Investigation
What are the factors that influence voting patterns? How do these factors influence government funding? Is participation the squeaky wheel gets the grease? Class members interpret graphs and analyze trends to determine what...
Curated OER
A World of Information
Students analyze data and statistics about countries around the world. They read graphs and charts, color a world map to illustrate the top ten statistics about the world, and write a paragraph to summarize their information.
Curated OER
Population and Productivity: Two P's in a Pod
Students investigate the link between countries' population growth rates and levels of industrialization. They observe that, over time, as a country becomes more industrialized, its population growth rate decreases.
Curated OER
Meeting the Needs of an Aging Population
Learners examine population trends and predict how the age of the majority of Canadians will change 15 years from now in various geographic areas. They will gather statistical evidence that supports their projection. Learners will then...
Curated OER
Charts, Maps, and Graphs Lesson on the Holocaust
Young scholars practice interpreting data. In this Holocaust lesson, students research selected Internet sources and examine charts, maps, and graphs regarding the Jewish populations in and out of Europe. Young scholars respond to...
Curated OER
The Geography of Africa
Hop a flight to Africa in this presentation, which includes brilliant and appealing photographs of the continent as well as maps and graphs about its geography, topography, and climate. Those who are researching Africa for a project or...
Curated OER
In the Wake of Columbus
Students explore how the population decreased in native cultures.
Sharp School
Geography Project
This very simple geography project can lead to a lot of useful referential information that can be displayed in your classroom! Learners construct a poster-size map of a country, identifying major demographic points and including pie/bar...
Curated OER
Geography of the United States
Students examine the population growth of the United States. In this Geography lesson, students construct a map of the fifty states. Students create a graph of the population of the USA.
Curated OER
Population and Population Density
Students read and interpret graphs. For this population lesson, students explore population and population density as they read several data graphs and respond to questions.
Curated OER
Route 66 And Population Patterns
Students investigate the geography located along Route 66. They research how the population patterns change in certain areas along the highway. Students use the information in order to form hypotheses about how and why the population...
Curated OER
What is the Population Distribution of Cartoon Characters Living On the Pages of Your Newspaper?
Students read various cartoons in their local newspaper and calculate the population demographics, spatial distribution and grouping of the characters. Using this information, they create a population distribution map and share them with...
Curated OER
Populations in the Path of Natural Hazards
Students read "Geographical Mobility: 1995-2000." They examine the maps in the handouts and compare them with maps from an atlas. In the second part of this lesson, students read "In Harm's Way." They receive three more handouts, one a...
Curated OER
Where is Everybody?
Students collect data from different grade levels at their school and develop thematic maps which show population density, and determine how this might affect the school and themselves in the future.
Curated OER
Great Lakes Homepage for Kids
Here are some outstanding lessons on the geology and history of the Great Lakes. These lessons are divided into Grade 4 -6, and Grade 7 - 8 activities. The activities all use the background information, maps, graphs, data, and Great...
Curated OER
Water, Water Everywhere?
Students discover the relationship between water availability and population growth. They change variables in a computer model using a worksheet to guide their hypotheses and conclusions. In small groups they choose a country undergoing...
Population Connection
Where Do We Grow from Here?
Did you know that the population is expected to grow to 11 billion by 2100? The resource serves final installment in a six-part series on the global population and its effects. Scholars interpret data from the United Nations about the...
Population Connection
The Peopling of Our Planet
How many people live on the planet, anyway? The first resource in a six-part series covers the topic of the world population. Scholars work in groups to conduct research and make population posters after learning about the global...
Population Connection
A Demographically Divided World
Did you know that birth and life rates vary across the world? The resource, the second in a six-part series, discusses just how demographics differ across countries and why it might be the case. Scholars complete worksheets, watch...


