Curated OER
Collecting Data to Learn About the People Around You
Human graphs, anyone? Did you eat fruit today? What is your favorite costume? Have your K – 6 learners graph the responses. Early elementary grades may count and compare while upper grades compare responses of different groups or make...
Curated OER
Conversation Heart Graphing
Sixth graders review the different types of graphs (bar, line, pictograph) They predict the data set they can garner several boxes of conversation hearts. Students record their data using an Excel spreadsheet. They create a graph based...
Curated OER
Parachute Drop
Learners will have fun creating a parachute to collect data with. They will construct the parachute in small groups, measure the materials, and create an observation sheet. Then they drop the parachute and make predictions about how long...
EngageNY
Informally Fitting a Line
Discover how trend lines can be useful in understanding relationships between variables with a lesson that covers how to informally fit a trend line to model a relationship given in a scatter plot. Scholars use the trend line to make...
California Education Partners
Science Fair Project
Plant the data firmly on the graph. Given information about the growth rate of plants, pupils determine the heights at specific times and graph the data. Using the information, scholars determine whether a statement is true and support...
Federal Reserve Bank
Less Than Zero
Perry the penguin wants to buy a new scooter, but he doesn't have any funds! Walk your kids through the short book Less Than Zero, and have them track his borrowing, spending, and saving on a line graph while you read. Pupils will learn...
Curated OER
Application of Graph Theory
Students investigate different online tutorials as they study graphing. In this graphing lesson, students apply the concept of graphs cross curricular and use it to make predictions. They define the purpose and theories behind graphs.
Curated OER
Usage and Interpretation of Graphs
Cooperative groups are formed for this graphing activity. Each group must construct a graph that represents how many eyelets (the holes for laces in shoes), are present in their group. A whole-class bar graph is eventually constructed...
Virginia Department of Education
Quadratic Curve of Best Fit
Class members create a table of the number of chords that can be drawn given the number of points on a circle. Pupils analyze the data created, find a function to fit to it, and use the function to make further predictions.
PBL Pathways
Students and Teachers
Predict the future of education through a mathematical analysis. Using a project-based learning strategy, classes examine the pattern of student-to-teacher ratios over a period of years. Provided with the relevant data, learners create a...
Curated OER
Birds' Eggs
More than just data, scatter plots are full of information that can be used to answer a variety of questions. This lesson uses a plot with information about bird egg sizes to answer questions about the relationship between length and...
EngageNY
Modeling with Polynomials—An Introduction (part 2)
Linear, quadratic, and now cubic functions can model real-life patterns. High schoolers create cubic regression equations to model different scenarios. They then use the regression equations to make predictions.
EngageNY
Tides, Sound Waves, and Stock Markets
Help pupils see the world through the eyes of a mathematician. As they examine tide patterns, sound waves, and stock market patterns using trigonometric functions, learners create scatter plots and write best-fit functions.
101 Questions
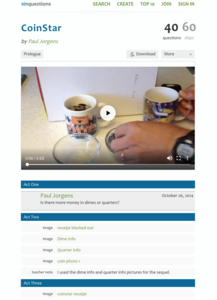
CoinStar
Would you rather have a bowl of dimes or a bowl of quarters? A video introduces the problem by presenting two bowls, one full of quarters and another full of dimes. Learners use information from a CoinStar receipt to calculate the number...
Curated OER
Hands On: Make Predictions
In this making predictions instructional activity, students use the line graph for marble numbers and colors to help them answer the questions about making predictions.
Curated OER
Make a Pass at Me
Students identify different types of functions and units of measurements. In this statistics lesson, students will collect data, graph their data and make predictions about their data. They plot a linear regression graph.
Virginia Department of Education
May I Have Fries with That?
Not all pie graphs are about pies. The class conducts a survey on favorite fast food categories in a lesson plan on data representation. Pupils use the results to create a circle graph.
Curated OER
Drive the Data Derby
Three days of race car design and driving through the classroom while guessing probability could be a third graders dream. Learn to record car speed, distances traveled, and statistics by using calculation ranges using the mean, median,...
EngageNY
Modeling a Context from Data (part 2)
Forgive me, I regress. Building upon previous modeling activities, the class examines models using the regression function on a graphing calculator. They use the modeling process to interpret the context and to make predictions based...
Virginia Department of Education
Linear Curve of Best Fit
Is foot length to forearm length a linear association? The class collects data of fellow scholars' foot length and the length of their forearms. They plot the data and find a line of best fit. Using that line, they make predictions of...
California Academy of Science
California's Climate
The United States is a large country with many different climates. Graph and analyze temperature and rainfall data for Sacramento and Washington DC as you teach your class about the characteristics of Mediterranean climates. Discuss the...
EngageNY
Searching a Region in the Plane
Programming a robot is a mathematical task! The activity asks learners to examine the process of programming a robot to vacuum a room. They use a coordinate plane to model the room, write equations to represent movement, determine the...
Radford University
Modeling Statistical Data
Can people predict the number of future divorces? Scholars research and analyze data on the number of divorces and teenage pregnancies in Virginia over time. They use the data to create graphs, determine the best-fit equations, and make...
Curated OER
Favorite Food
Students are given three choices of food. They then decide on their favorite and predict what the class's favorite food will be. After the teacher enters the data into the computer, students gather around the computer to view the...


