Curated OER
A Ststistical Study on the Letters of the Alphabet
In this Statistics and Probability worksheet, students create a line plot for the first 100 letters in the Preamble to the constitution and compare their frequency distributions to the actual frequency distribution. The one page...
Curated OER
Chapter 11 What's Your Preference
In this math learning exercise, students record the results of a survey taken from family members about relationships and activities.
Curated OER
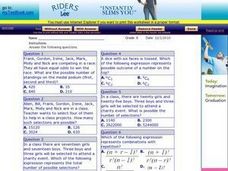
Combinations & Permutations
In this combination and permutations activity, students identify possible outcomes. They determine if the given situation is a combination or permutation and solve accordingly. This one-page activity contains 10 multiple choice...
Virginia Department of Education
Scatterplots
Math is all fun and games with this activity! Learners use an activity designed around hula hoops to collect data. They create scatter plots with their data and then analyze the graphs for correlation.
Virginia Department of Education
Graphs
Examine different types of graphs as a means for analyzing data. Math scholars identify the type of graph from a series of data displays and then develop questions to match each one. Then, given a scatter plot of height versus age data,...
Virginia Department of Education
May I Have Fries with That?
Not all pie graphs are about pies. The class conducts a survey on favorite fast food categories in a lesson plan on data representation. Pupils use the results to create a circle graph.
National Council of Teachers of Mathematics
Eruptions: Old Faithful Geyser
How long do we have to wait? Given several days of times between eruptions of Old Faithful, learners create a graphical representation for two days. Groups combine their data to determine an appropriate wait time between eruptions.
Shmoop
Box, Stem-Leaf, and Histogram
A helpful and versatile instructional activity requires young mathematicians to analyze data in order to create graphs and answer questions. Additionally, it prompts learners to find the mean, median, mode, and range of some of the data...
Illustrative Mathematics
Accuracy of Carbon 14 Dating I
Here is an activity that is intended to highlight a very important issue about precision in reporting and understanding statements in a realistic scientific context. Discuss different ways of reporting the half life of Carbon 14 using...
Inside Mathematics
Archery
Put the better archer in a box. The performance task has pupils compare the performance of two archers using box-and-whisker plots. The resource includes sample responses that are useful in comparing individuals' work to others.
Curated OER
The Titanic 2
Did the rescue procedures on the Titanic favor the first-class passengers? Use actual historical data to explore independent and dependent events with your class. Part of a series of worksheets, but can be used separately.
Curated OER
Breakfast Before School
Are the events "I eat breakfast" and "I am late for school" independent events? Assess learners' understanding of independence in a simple context with this short learning exercise. Use as an opener, as part of an assignment, or discuss...
EngageNY
End-of-Module Assessment Task: Grade 7 Mathematics Module 5
Show learners how to use simulations and random sampling to reach conclusions with the last resource in a 25-part series. The assessment contains three scenarios, each with several parts, and covers comparing populations using random...
Noyce Foundation
Ducklings
The class gets their mean and median all in a row with an assessment task that uses a population of ducklings to work with data displays and measures of central tendency. Pupils create a frequency chart and calculate the mean and median....
Inside Mathematics
Scatter Diagram
It is positive that how one performs on the first test relates to their performance on the second test. The three-question assessment has class members read and analyze a scatter plot of test scores. They must determine whether...
Curated OER
M&M Science and Math
A series of math and science activities feature M&M's® as manipulatives to help kids work through equations. The resource includes exercises on finding averages, percent of compositions, moles in chemical reactions, genotypes and...
National Security Agency
Going Green with Graphs
In this unit designed for second graders, youngsters are introduced to conducting surveys and creating tally charts based on the data they gather. Students then construct bar graphs, and observe the relationships between the two types of...
Inside Mathematics
Snakes
Get a line on the snakes. The assessment task requires the class to determine the species of unknown snakes based upon collected data. Individuals analyze two scatter plots and determine the most likely species for five additional data...
Inside Mathematics
House Prices
Mortgages, payments, and wages correlate with each other. The short assessment presents scatter plots for young mathematicians to interpret. Class members interpret the scatter plots of price versus payment and wage versus payment for...
Inside Mathematics
Population
Population density, it is not all that it is plotted to be. Pupils analyze a scatter plot of population versus area for some of the states in the US. The class members respond to eight questions about the graph, specific points and...
Education Development Center
Choosing Samples
What makes a good sample? Your classes collaborate to answer this question through a task involving areas of rectangles. Given a set of 100 rectangles, they sample a set of five rectangles to estimate the average area of the figures. The...
Curated OER
Math is Everywhere! Post Test
In this math test activity, students complete 10 multiple choice questions covering a wide variety of math concepts. An answer link is included.
Curated OER
Modern Physics, New Phenomena
In this physics worksheet, students examine some of the historical theories of physics through the completion of 11 questions.
Curated OER
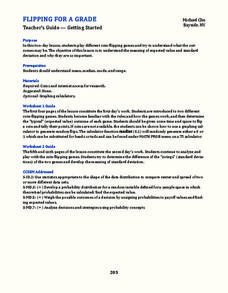
Flipping for a Grade
What happens when your teachers get tired of grading tests and want to use games of chance to determine your grade? How would you decide which game they should play? Learn how to use expected value and standard notation to compare two...


