Curated OER
Coal Supply and Demand
A hands-on simulation perfect for an economics lesson, young learners investigate the availability of different sources of natural energy (coal, natural gas, oil, solar, and nuclear) and how this availability affects their cost. Simulate...
Shodor Education Foundation
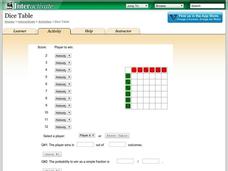
Dice Table
Convert a table to probabilities. Pupils set up the winning rules for the sums of two dice. Using the rules, the applet fills out a table showing the winners for each combination. Learners determine the probabilities of winning for each...
Beyond Benign
Can You Hear Me Now? Cell Phone Accounts
How sustainable are cell phones? Throughout the unit, learners explore the issues around cell phones concerning sustainability. Class members take a graphical look at the number of cell phones across the world using a box-and-whisker...
Curated OER
Capture/Recapture
Middle schoolers use proportions to estimate the size of populations. They describe the data with using a graph or table of the estimate. Students use descriptive statistics to calculate mean, median, and mode. They also compare and...
Curated OER
Normal Curve Areas
In this normal curve areas worksheet, students follow 6 steps to compute the probability regarding the possible sample of proportions using a large sample population. First, they label the Ps-scale with the proportion and corresponding...
101 Questions
Yellow Starbursts
Let the task burst your mind. Scholars estimate the frequency that both Starbursts in a pack are yellow out of 287 packs. They apply probability concepts to complete the sweet task.
Curated OER
What's Math Got To Do With It?
Students explore numbers, computation, ratios, proportions, probabilities, statistics, and money in this six lessons unit. Practical applications in the real world are emphasized through an interactive approach to math in these lessons.
Curated OER
Chaos
Young scholars explore the concept of probability. In this probability lesson plan, students use a applet that demonstrates chaos and probability of spread for a forest fire. Young scholars also play applets about the Game of Life and...
Curated OER
SAT Grid Practice Test 07
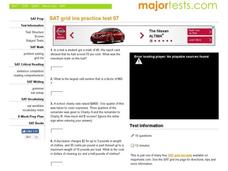
For this practice test worksheet, students solve percent problems, find the probability of given events, determine the median, and find the unit price. This one page worksheet contains ten multi-step problems.
Curated OER
M&M Caper
Students participate in a game with M&M's to be introduced to percents and ratios. Individually, they estimate and record the number of candies they believe the bag holds and the amount of each colored candy. They open the bag and...
Curated OER
Estimating With Fire
Students solve problems with percents, decimals and fractions. In this algebra lesson, students convert between fractions, percents and decimals. They estimate their answers and calculate their answer.
Curated OER
Spinner Experiment
Pupils collect and analyze data, then draw conclusions from the data and apply basic concepts of probability.
Curated OER
The Birthday Problem
In this probability worksheet, students solve 1 word problem about birthdays. Students determine the number of people needed for a 50% chance of two people sharing the same birthday.
Curated OER
Statistics and Shopping
Explore how statistics are used in everyday life. Your soon-to-be savvy consumers use the Internet to find consumer-related statistical information and learn to make wise consumer decisions. Includes links to a practice sheet about data...
Curated OER
Confidence Intervals: Population Mean; Population Standard Deviation Unknown
In this confidence interval worksheet, young scholars examine given statistical information to find the margin of error. They construct a confidence interval for the population and find the mean. Seven statistical problems are available...
Curated OER
Graphs: All About Our Class
Students respond to survey questions, discuss results, brainstorm ways to represent survey information, and create table of class results. They find mean, range, and percentages, and create graph to display results.
Illustrative Mathematics
Tax and Tip
Finding out how to calculate tax and tip is a valuable skill that all young adults should be able to do without a calculator. Learners are given a bill and asked to calculate the tax, tip, and total amount. Calculations can be exact or...
Shodor Education Foundation
Tree Diagrams and Probability
Aspiring statisticians create tree diagrams and figure probabilities of events based on those diagrams. They practice adding and multiplying fractions and explain complementary probabilities. Students use computers activities to make...
Curated OER
Data Analysis, Probability, and Discrete Math: Lesson 6
Eighth graders engage in a lesson that is concerned with the concepts surrounding the interpretation of information included in graphs for analysis of data for probability. They examine circle graphs and differentiate the values of...
Curated OER
Hurricane Influence: Landfall Probabilities and Wind Speed
In this earth science worksheet, students study a hurricane map and answer 7 multiple choice question about it. They calculate the wind speed on different areas of the map.
Florida Center for Instructional Technology
Integrating Mathematics into Literature
You class will read Cucumber Soup by Vickie Leigh Krudwig as an anticipatory set for this lesson plan on ratios. They make models of the insects in the story and then use them as a source of data for this ratio and proportion lesson...
Shodor Education Foundation
Spread of Disease
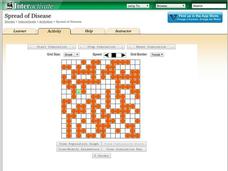
Control the spread of a contagious disease. An applet allows pupils to run a simulation on the spread of a disease. Rules govern how the disease is spread and the length of time it takes to recover. Learners view the spread visually and...
Curated OER
World Statistic Day
Eleventh graders collect data about the state they live in. For this statistics lesson, 11th graders collect and analyze data as they compare themselves to students in other states. They analyze data about a person's education level, and...
Curated OER
M&M Science and Math
A series of math and science activities feature M&M's® as manipulatives to help kids work through equations. The resource includes exercises on finding averages, percent of compositions, moles in chemical reactions, genotypes and...


