CCSS Math Activities
Smarter Balanced Sample Items: 7th Grade Math – Target I
The probability is high that these questions will challenge your pupils! The ninth and final installment of the Grade 7 Claim 1 Slideshow series, a set of items assesses the understanding of simple and compound probability concepts....
Illustrative Mathematics
Fred's Fun Factory
Spin to win! Individuals calculate the average number of tickets expected based on a probability distribution for the number of tickets per spin. Pupils use that information to determine the average number of tickets that can be won...
Balanced Assessment
Dog Tags
Class members demonstrate a proficiency with conditional probabilities through this task. Individuals calculate probabilities using multiplication and addition. They also distinguish between repetition and non-repetition while...
Los Angeles County Office of Education
Assessment For The California Mathematics Standards Grade 4
Have scholars show what they know with a 20-page assessment aligned to the California State Standards. The test covers concepts such as large and whole numbers, all four mathematical operations, fractions, decimals, geometric figures,...
Inside Mathematics
Winning Spinners
Winning a spin game is random chance, right? Pupils create a table to determine the sample space of spinning two spinners. Individuals determine the probability of winning a game and then modify the spinners to increase the probability...
Los Angeles County Office of Education
Assessment For The California Mathematics Standards Grade 6
Test your scholars' knowledge of a multitude of concepts with an assessment aligned to the California math standards. Using the exam, class members show what they know about the four operations, positive and negative numbers, statistics...
CCSS Math Activities
Rolling for the Big One
Knowing math helps you win games. Learners apply conditional probability concepts in an engaging performance task. After playing a game in which players roll a 10-sided polyhedron and then try to place the digits to get the highest...
Balanced Assessment
Chance of Survival
Class members determine the chance of surviving two years by explaining the concept of probability expressed in a medical terms. Would-be doctors continue to explain a conditional probability statement as it relates to the...
College Board
2006 AP® Statistics Free-Response Questions Form B
Test a significant review of statistical questions. The resource provides pupils and teachers with insight into the way the exam assesses statistical concepts. Half of the released questions from the 2006 AP® Statistics Form B...
Balanced Assessment
MasterMind
Knowledge of statistics and probability can increase your advantage when playing games. The activity asks learners to analyze the game of MasterMind to determine the number of possible codes. They also examine different variations of the...
Concord Consortium
Bill the Ball Bearing Man
Just how durable could a hollow ball bearing be? Learners model the strength of the walls of a ball bearing as a function of the radius of its cavity. They use their models to make reasonable conclusions about the probability of failure...
EngageNY
Chance Experiments with Equally Likely Outcomes
Take a deeper dive into equally likely probabilities. Pupils build upon their understanding of probability by determining sample spaces and outcomes. Individuals work with sample spaces and determine outcomes that are equally likely....
College Board
2002 AP® Statistics Free-Response Questions Form B
Develop a deeper understanding of statistics. The six released free-response items from the 2002 AP® Statistics Form B involve several concepts that are currently in the regular statistics standards. Teachers see how...
College Board
2003 AP® Statistics Free-Response Questions Form B
Update the statistics in your course using older AP® questions. The 2003 AP® Statistics free-response questions cover several of the concepts in the current statistics standards for all pupils. Items contain questions about...
College Board
2014 AP® Statistics Free-Response Questions
Turn a summative assessment into a formative assessment! The 2014 AP® Statistics exam shows learners the level of difficulty they will encounter on their end-of-course exams. Within the six items, the test highlights concepts such...
College Board
2017 AP® Statistics Free-Response Questions
Reduce testing anxiety by helping learners prepare for test day. Scholars complete six free-response questions from a released AP® exam. The questions test a variety of concepts including confidence intervals, frequency tables,...
College Board
2007 AP® Statistics Free-Response Questions Form B
So that is how they do it! Pupils and teachers see how College Board assesses topics using the free-response questions from Form B of the 2007 AP® Statistics test. The six questions are divided in two sections, the first five being...
Balanced Assessment
Batting Orders
A baseball coach has more than 700 billion decisions to make before a game even starts, and in this resource individuals calculate the number of ways a coach can make a batting lineup. The first question places nine players out of nine....
Curated OER
Alex, Mel, and Chelsea Play a Game
This short probability question may look simple at first, but it is actually quite complex! Learners must understand independent events in context and must take into account several different scenarios. Use as an individual assignment...
Curated OER
Rain and Lightning
What are the chances that there will be rain and lighting today? Use this activity to study independent and dependent probabilities with your class. Learners explore the differences between P(A and B) and P(A or B) using mock...
Curated OER
Patterns in the Multiplication Table
Explore patterns in the multiplication table in order to deepen your third graders' understanding of this essential skill. Implement this activity as a whole-class lesson, allowing students to work in pairs or small groups to support...
Inside Mathematics
Suzi's Company
The mean might not always be the best representation of the average. The assessment task has individuals determine the measures of center for the salaries of a company. They determine which of the three would be the best representation...
EngageNY
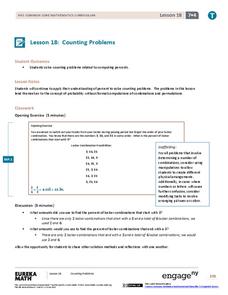
Counting Problems
Solving these percent problems is a matter of counting. Pupils find percents by counting the number of events that meet the criteria and the total number of possibilities. Participants create the ratio and convert it to a percent to...
EngageNY
Summarizing a Data Distribution by Describing Center, Variability, and Shape
Put those numbers to work by completing a statistical study! Pupils finish the last two steps in a statistical study by summarizing data with displays and numerical summaries. Individuals use the summaries to answer the statistical...


