Virginia Department of Education
Logarithmic Modeling
Explore logarithms and logarithmic regression. Young mathematicians first learn about inverse functions and about the logarithm function family. They take their newfound knowledge to use logarithmic functions to model situations and...
Kenan Fellows
Lego Thinking and Building
Run a simulated airplane manufacturing plant with your pupils as the builders! Learners build Lego airplane models and collect data on the rate of production, comparing the number produced to the number defective. Using linear...
EngageNY
Modeling with Polynomials—An Introduction (part 2)
Linear, quadratic, and now cubic functions can model real-life patterns. High schoolers create cubic regression equations to model different scenarios. They then use the regression equations to make predictions.
Radford University
Real World Data
Make math class feel more real by using real-world data. Scholars research or collect data on several different topics, such as nutrition, the motion of moving objects, cooling curves, and daylight hours. They create scatter plots using...
Balanced Assessment
Monitor Pricing
Out with the old and in with the new. Learners use a set of prices of computer monitors from 1994 to make a prediction. They then use one current price and what they know about the old prices to make a more recent prediction. Their...
Radford University
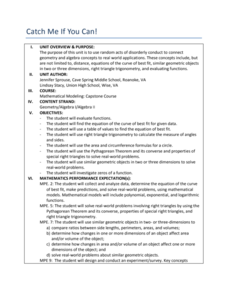
Catch Me If You Can!
Crime doesn't pay, but everyone can learn from it. Learners consider different situations involving mischief at a school, such as stink bombs and rockets, and analyze them using mathematics. They must apply trigonometry, quadratic...
Curated OER
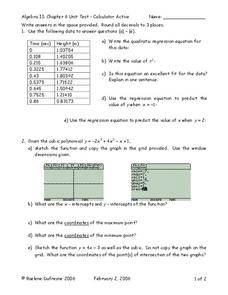
Polynomial Functions
In this Algebra II worksheet, 11th graders use a graphing calculator to determine the regression equation of the given data, graph polynomial functions, factor polynomials, and determine the quotient and remainder in polynomial division....
Curated OER
Curve Fitting
Pupils investigate linear, quadratic, and exponential regressions. They plot sets of data points, determine the regression equation that best fits the data and lastly investigate the coefficient of determination.
Curated OER
Quadratic Regression Lab
Students use real temperature data from the Chesapeake Bay, to begin to see some natural mathematical phenomena, and to begin to interpret the data mathematically.
Radford University
Sleep and Teen Obesity: Is there a Correlation?
Does the number of calories you eat affect the total time you sleep? Young mathematicians tackle this question by collecting their own data and making comparisons between others in the class through building scatter plots and regression...
Curated OER
Don't Let Parabolas Throw You
Students identify relation, function, patterns and range. In this algebra lesson, students factor and graph quadratic equations. They use transformation to move the parabola around and make predictions.
Curated OER
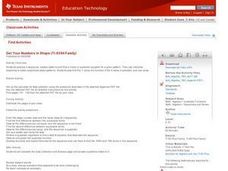
Get Your Numbers in Shape - TI-83
High Schoolers use the TI-83 calculator to produce a sequence, explore patterns and find a linear or quadratic equation for a given pattern. They use inductive reasoning to make conjectures about patterns. They find the Y-value of a...
Virginia Department of Education
Curve of Best Fit
Which function models the data best? Pupils work through several activities to model data with a variety of functions. Individuals begin by reviewing the shapes of the functions and finding functions that will fit plotted data points. By...
PBL Pathways
Students and Teachers 2
Examine trends in student-to-teacher ratios over time. Building from the first task in the two-part series, classes now explore the pattern of student-to-teacher ratios using a non-linear function. After trying to connect the pattern to...
Kenan Fellows
Density
Most scholars associate density with floating, but how do scientists determine the exact density of an unknown liquid? The third activity in a seven-part series challenges scholars to find the mass and volume of two unknown liquids. Each...
Curated OER
Strike a Pose: Modeling in the Real World (There's Nothing to It!)
Adjust this lesson to fit either beginning or more advanced learners. Build a scatter plot, determine appropriate model (linear, quadratic, exponential), and then extend to evaluate the model with residuals. This problem uses real-world...
Curated OER
Calculator-Based Lessons Help Examine Real-World Data
Students may determine equations based on graphs and regression models.
Radford University
Curve of Best Fit
Don't watch the resource go down the drain. Scholars perform an experiment where they measure the amount of water that flows from a funnel over time. They use the data to create graphs and find the curves of best fit.
Curated OER
Polynomial Functions
Students explore polynomial functions. In this Algebra II lesson, students explore graphs of polynomial functions as classify the functions as linear, quadratic, cubic, or quartic. Students determine the regression equation for each...
Curated OER
Means of Growth
Students collect and graph data. In this statistics lesson, students analyze their plotted data using a scatter plot. They identify lines as having positive, negative or no correlation.
Curated OER
TI-89 Activities for PreCalculus and AP Calculus
Using the TI-89 calculator, learners explore the statistical, graphical and symbolic capabilities of the TI-89. Students investigate topics such as solving systems of equations, finding inverse functions, summations, parametrics and...
Mathalicious
Pic Me!
Finally! Math and Instagram have come together to discuss the correlation between likes and followers. High schoolers can't help but want to discover what makes one account more popular than another by developing a line of best fit and...
Mathalicious
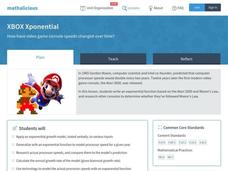
XBOX Xpotential
Touchdown! This is an exponentially insightful lesson that explores the growth of football games with different video game consoles. Class members discuss whether the increase of mergahertz can be described as linear or exponential. The...
Curated OER
How Long Can You Go?
Eighth graders examine the usefulness of a line of best fit by collecting and graphing data, using a graphing calculator to determine the line of best fit, and making a variety of predictions. They watch a video, then design a...


