Noyce Foundation
Ducklings
The class gets their mean and median all in a row with an assessment task that uses a population of ducklings to work with data displays and measures of central tendency. Pupils create a frequency chart and calculate the mean and median....
Willow Tree
Graphing
So many methods and so little time! The efficient method of graphing a linear equation depends on what information the problem gives. Pupils learn three different methods of graphing linear equations. They graph equations using...
Curated OER
Learning to Make Data Tables
Students construct data tables using the results of previous experiments. In this graphing lesson, students plot data and interpret the results. Students discuss how they organized their data.
Curated OER
Statistics
Seventh and eighth graders solve and complete three various types of problems. First, they find the median rate using the box-and-whisker plot shown. Then, learners describe the inter-quartile range. In addition, they determine whether...
Curated OER
Identifying Features of Nonfiction Text
Learners explore nonfiction text. They identify the cover, title page, and table of contents of a nonfiction book. Pupils work in groups to create a chapter for a nonfiction class book about heroes.
Inside Mathematics
Winning Spinners
Winning a spin game is random chance, right? Pupils create a table to determine the sample space of spinning two spinners. Individuals determine the probability of winning a game and then modify the spinners to increase the probability...
Mathematics Assessment Project
Statistics and Probability
Quickly assess basic understandings of statistics and probability. The resource contains five quick tasks from the probability and statistics domain. The questions range from finding simple conditional probabilities to measures of center...
Key Stage Fun
Squeebles Times Tables 2
The Squeebles are back, and this time they are ready to help young mathematicians gain fluency in their multiplication skills. This app allows for practice and testing through a number of fun, and at times, challenging, educational games.
Curated OER
Random Number Generators And Probability, Will the Wings Win??
Young scholars participate in probability experiments and simulations while modeling and solving problems. They examine how to use the random number generator on a graphing calculator using examples from their local hockey teams.
EngageNY
Sampling Variability and the Effect of Sample Size
The 19th installment in a 25-part series builds upon the sampling from the previous unit and takes a larger sample. Pupils compare the dot plots of sample means using two different sample sizes to find which one has the better variability.
Curated OER
Galaxy Hunter - A Cosmic Photo Safari
Space science stars journey through our night sky and take virtual photos of galaxies to investigate simple random samples. Higher math is used to analyze the data collected. Copy the evaluation/assessment questions onto a handout for...
Curated OER
Counting by Three's: Random
In this math worksheet, students complete 5 tables in which they follow directions to skip count by three. They start at the random number which is indicated, and skip count to find the next nine numbers in each set.
Curated OER
Lesson 6-7: Scatter Plots and Equations of Lines
In this scatter plot worksheet, students examine tables and write a linear equation that matches the table. Students graph linear equations. They read scatter plots, determine the trend line, and write a linear equation to match...
Curated OER
The Five Senses
Learners explore the 5 senses. In this biology lesson plan, students demonstrate the ability to identify objects through the use of the five senses as they complete 5 activities.
CCSS Math Activities
Smarter Balanced Sample Items: 7th Grade Math – Target G
Don't leave learning to chance! Assess your class's understanding of random sampling and making inferences using questions from the experts at Smarter Balanced. As the seventh of nine parts in the Gr. 7 Claim 1 Item Slide Shows series,...
Mathematics Assessment Project
Sampling and Estimating: Counting Trees
Your task today: count all the trees on a tree farm. To complete the assignment, learners first estimate the number of trees on a tree farm using random sampling. To improve their own response they then evaluate provided responses to the...
Biology Corner
Random Sampling
Simulate a random sampling of data by tearing 20 sheets of paper into slips and place a number on 10 and a letter on 10. They place the slips in two separate containers and randomly draw a number and a letter. They record their...
Curated OER
The Three Major Monotheistic Religions
This activity gives young scholars an opportunity to learn about the three major monotheistic religions in a fun and challenging way, while also allowing them to hone their library research skills. Students research one of the three...
Curated OER
Valentine Marbles
if you've ever had to guess how many items were in a jar, then this problem is for you! With a big jar full of red and white marbles, does picking a sample of 16 allow your learners to get a good estimate on the percentages of each...
EngageNY
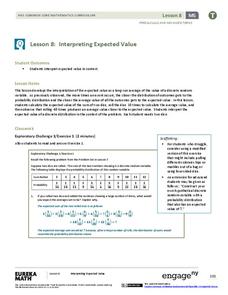
Interpreting Expected Value
Investigate expected value as a long-run average. The eighth installment of a 21-part module has scholars rolling pairs of dice to determine the average sum. They find aggregate data by working in groups and interpret expected value as...
Illustrative Mathematics
How Many Buttons?
Bring the class into the probability by having everyone count buttons on their shirts. Organize the data into the chart provided and chose different possibilities such as "female with one button" or "all middle schoolers with more than...
Mathed Up!
Pie Charts
Representing data is as easy as pie. Class members construct pie charts given a frequency table. Individuals then determine the size of the angles needed for each sector and interpret the size of sectors within the context of frequency....
Shodor Education Foundation
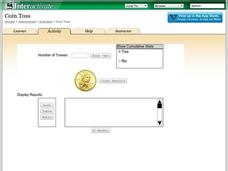
Coin Toss
Are your young mathematicians having a hard time making heads or tails of probabilities? It's no toss up—here is a resource that's sure to straighten them out! Learners run the interactive to toss a coin a different number of times....


