Virginia Department of Education
Linear Modeling
An inquiry-based algebra lesson explores real-world applications of linear functions. Scholars investigate four different situations that can be modeled by linear functions, identifying the rate of change, as well as the strength and...
EngageNY
Comparing Linear Functions and Graphs
How can you compare linear functions? The seventh installment of a 12-part module teaches learners how to compare linear functions whose representations are given in different ways. They use real-world functions and interpret features in...
Mathematics Vision Project
Quadratic Functions
Inquiry-based learning and investigations form the basis of a deep understanding of quadratic functions in a very thorough unit plan. Learners develop recursive and closed methods for representing real-life situations, then apply these...
Curated OER
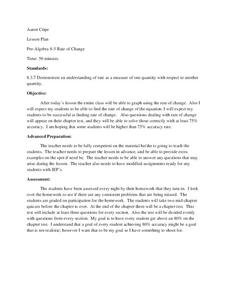
Rate of Change
Eleventh graders solve problems dealing with rate of change. In this algebra lesson plan, 11th graders graph their rate of change problems and analyze it comparing their data with each other. They solve problems dealing with percent and...
Curated OER
Linear Graph
Students solve linear equations and graph the different functions. In this algebra lesson, students graph piecewise functions using the slope and y-intercept and the given restrictions on the domain of the line. They discuss rate of...
Utah Education Network (UEN)
Linear Graphs Using Proportions and Rates
Using a TI-73 or other similar graphing calculator middle school math majors investigate the linear relationship of equivalent proportions. After a brief introduction by the teacher, class members participate in a timed pair share...
Curated OER
Drug Sales Soar - Rate of Change
In this prescription drug worksheet, learners answer short answer questions and create graphs on the sales of prescription drugs over a five year span. Students complete six questions.
Curated OER
Introducing y = mx + b
Middle and high schoolers use the slope intercept form to graph a line. In this algebra lesson, pupils rewrite equations from standard form to y-intercept form. They use the slope and y-intercept to graph a line without making a table of...
Curated OER
Y-Intercept and Slope Intercept Form
Alegebra amateurs identify the slope and the y-intercept given a linear equation in slope-intercept form by correctly completing some in class problems. They write the linear equation in slope-intercept form that corresponds to the given...
Curated OER
Using Graphs
Print and use this useful unit on basic algebraic functions, domain, range, and graphing. Tasks include, illustrating simple functions with a graph, and identifying the domain and range of the function. This twelve-page packet contains...
EngageNY
Constant Rates Revisited
Find the faster rate. The resource tasks the class to compare proportional relationships represented in different ways. Pupils find the slope of the proportional relationships to determine the constant rates. They then analyze the rates...
CCSS Math Activities
Smarter Balanced Sample Items: High School Math – Target L
Functions are for forming context models. A PowerPoint file contains 11 questions for learners to answer. It covers the high school SBAC Claim 1 Target L item specifications and requires interpreting functions, determining appropriate...
Curated OER
Dragonfly
The speed of a dragonfly brings math into the real world as your learners collaboratively see the value in calculating unit rates in direct proportion problems. This six-phase lesson plan encourages you, as the teacher, to only ask...
Howard County Schools
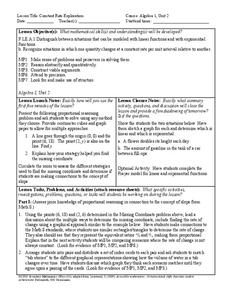
Constant Rate Exploration
Question: What do rectangles and bathtub volume have in common? Answer: Linear equations. Learn how to identify situations that have constant rates by examining two different situations, one proportional and one not proportional.
Curated OER
Mathematical Modeling and constant Rate Equations
In this rates learning exercise, students solve five story (word) problems related to rate and time. In two of the problems students are directed to create a graph of the problem.
Virginia Department of Education
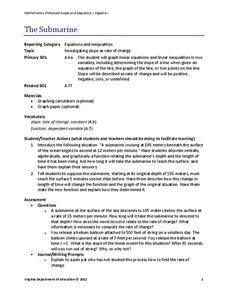
The Submarine
Submerge yourself in the study of slope. Scholars investigate a situation involving slope and the rate of change of a submarine. An additional example further explores the concept of slope by changing one of the conditions of the submarine.
Balanced Assessment
On Averages and Curves
Determine the average on a curve. The class finds graphical representations of averages and expresses them both symbolically and on the graph. The assessment requires class members to justify using average to describe graphs.
Inside Mathematics
Squares and Circles
It's all about lines when going around. Pupils graph the relationship between the length of a side of a square and its perimeter. Class members explain the origin in context of the side length and perimeter. They compare the graph to the...
Curated OER
Sandia Aerial Tram
Your learners analyze a table of real-life data in order to write an equation that best models the information. Exponential, quadratic, and linear rates of changes are all possibilities in this task.
Teach Engineering
Matching the Motion
It is not always easy to walk the straight and narrow. In the sixth portion of a nine-part unit, groups actively recreate a graph depicting motion. Individuals walk toward or away from a motion detector while trying to match a given...
EngageNY
Increasing and Decreasing Functions 1
Model situations with graphs. In the fourth installment of a 16-part module, scholars learn to qualitatively analyze graphs of piecewise linear functions in context. They learn to sketch graphs for different situations.
Balanced Assessment
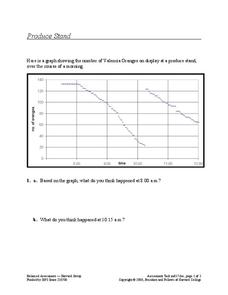
Produce Stand
Interpret a graph of the number of oranges at a produce stand to determine a likely event at different times. They also analyze the graph to determine which time period oranges were selling most quickly.
101 Questions
Slow Church
The church that just can't stay put! A video presentation raises questions of just how far the church will move. Presented with the rate of movement and a range of time expected, scholars build an inequality to answer the question.
Mathalicious
The Fall of Javert
Falling off a bridge might not sound like your idea of a good math problem, but incorporating the final scene of Les Misérables is sure to spark interest. The goal is to use the time Javert fell off the bridge to determine how high he...


