Natinal Math + Science Initative
Slope Investigation
Context is the key to understanding slope. A real-world application of slope uses a weight loss scenario with a constant rate of change to introduce the concept of slope of a line, before it makes a connection to the ordered pairs and...
Curated OER
Algebra 1: Slope as Rate
Students solve problems with slopes. In this algebra lesson, students identify the slope of a line and relate it to the rate of change. They graph their lines on the TI and observe changes in the lines.
EngageNY
Euler’s Number, e
Scholars model the height of water in a container with an exponential function and apply average rates of change to this function. The main attraction of the instructional activity is the discovery of Euler's number.
Project Maths
Introduction to Calculus
Don't let your class's heart rates rise as you introduce them to differentiation ... an inquiry-based instructional activity helps them keep it in check! The second instructional activity in a three-part series asks learners to analyze...
EngageNY
Graphs of Simple Nonlinear Functions
Time to move on to nonlinear functions. Scholars create input/output tables and use these to graph simple nonlinear functions. They calculate rates of change to distinguish between linear and nonlinear functions.
EngageNY
Constant Rates Revisited
Find the faster rate. The resource tasks the class to compare proportional relationships represented in different ways. Pupils find the slope of the proportional relationships to determine the constant rates. They then analyze the rates...
Kenan Fellows
Man vs. Beast: Approximating Derivatives using Human and Animal Movement
What does dropping a ball look like as a graph? An engaging activity asks learners to record a video of dropping a ball and uploading the video to software for analysis. They compare the position of the ball to time and calculate the...
Curated OER
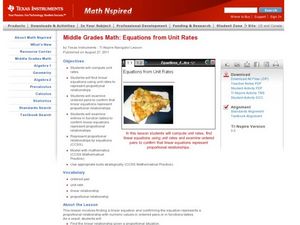
Equations from Unit Rates
Your class can become linear equations masters, as they calculate the rate of change of a function. They observe different types of coordinates as they relate to a graph, then use the Ti-navigator to move the line around and draw...
Curated OER
Move My Way: A CBR Analysis of Rates of Change
Learners match a given velocity graph and sketch the corresponding position graph using a graphing calculator. After collecting data from their everyday life, students use specific functions on their calculators to create graphs and...
Curated OER
Dragonfly
The speed of a dragonfly brings math into the real world as your learners collaboratively see the value in calculating unit rates in direct proportion problems. This six-phase lesson encourages you, as the teacher, to only ask questions...
EngageNY
From Rates to Ratios
Look at rates from a general perspective. The 17th part of a 29-part series provides problems that help pupils develop more general ratios from given rates. Scholars determine unit rates and ratios that are associated with given rates....
Curated OER
The Effect of Math Anxiety on Cardiovascular Homeostasis
Using a pulse monitor, learners will measure a resting pulse, take a math test, and then measure the pulse again. They analyze the change in pulse and compare it to performance on the test. This multi-purpose lesson can be used in a...
Utah Education Network (UEN)
Linear Graphs Using Proportions and Rates
Using a TI-73 or other similar graphing calculator middle school math majors investigate the linear relationship of equivalent proportions. After a brief introduction by the teacher, class members participate in a timed pair share...
Curated OER
Rate of Change
Eleventh graders solve problems dealing with rate of change. In this algebra lesson, 11th graders graph their rate of change problems and analyze it comparing their data with each other. They solve problems dealing with percent and rate...
Illustrative Mathematics
Chicken and Steak, Variation 2
Many organizations put on barbecues in order to make money. In a real-world math problem, the money allotted to purchase steak and chicken at this barbecue is only one hundred dollars. It is up to your potential chefs to figure out how...
California Mathematics Project
Meteorology
See how estimation is essential to making temperature weather maps. Scholars use ratios and rates of change to estimate temperatures at locations where temperature readings have not been made. They connect this idea to linear functions.
Virginia Department of Education
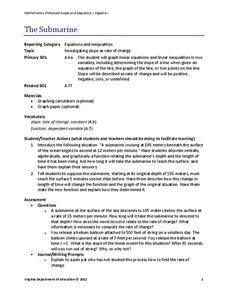
The Submarine
Submerge yourself in the study of slope. Scholars investigate a situation involving slope and the rate of change of a submarine. An additional example further explores the concept of slope by changing one of the conditions of the submarine.
EngageNY
Linear Functions and Proportionality
Connect linear equations, proportionality, and constant rates of change to linear functions. Young mathematicians learn how linear equations of the form y = mx + b can represent linear functions. They then explore examples of linear...
Howard County Schools
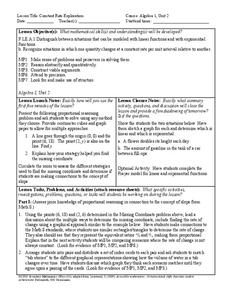
Constant Rate Exploration
Question: What do rectangles and bathtub volume have in common? Answer: Linear equations. Learn how to identify situations that have constant rates by examining two different situations, one proportional and one not proportional.
Illustrative Mathematics
Find the Change
This exercise is an opportunity for algebra learners to understand the connection between the slope of a line and points found on the line. Use similar triangles to explain why slope m is the same between any two points. Discuss with the...
Curated OER
Environmental Agents of Mathematics: Mathematics for Change
High schoolers analyze environmental science data using Math. They do research about renewable energy, gather data, create graphs and interpret their findings. Then the group presents their arguments persuasively using their findings to...
Curated OER
Bacteria Populations
Your young microbiologists will interpret and solve exponential equations in this real-world context task set in a hospital research scenario. Learners think in terms of the functions as well as their rates of change.
Nuffield Foundation
Investigating Factors Affecting the Breathing Rate of a Locust
Do animals breathe faster when given more oxygen or more carbon dioxide? Young scientists observe the respiration rates of locusts under a variety of gas concentrations to answer that very question. They collect data, analyze the...
Mixing In Math
Mixing in Math: Growing Plants
Whether you have your class plant seeds or begin when sprouts are visible, math skills are used here to predict and track growth over time. Straw bar graphs show plant height on a given day while the graph as a whole shows changes over...


