Curated OER
Population Growth Rates
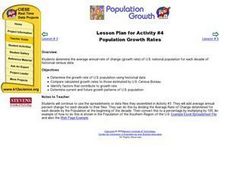
Students determine the average annual rate of change (growth rate) of U.S. national population for each decade of historical census data.
Curated OER
Polly and the Shapeshifter
Students analyze the patterns in polygons and relate it to the rate of change. In this algebra lesson, students discuss the relationship between the data and the graph of the data.
Curated OER
Extrema on an Interval
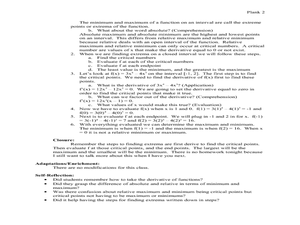
Students explore maximum and minimum points, slopes and tangents. In this Pre-Calculus activity, students solve optimization problems and find rates of change.
Chicago Botanic Garden
Climate Change Around the World
Look at climate change around the world using graphical representations and a hands-on learning simulation specified to particular cities around the world. Using an interactive website, young scientists follow the provided directions to...
Curated OER
Lessen the Loan
Middle-schoolers explore the concept linear equations. They use the internet to navigate through videos and problems. Pupils problem solve to determine rates of change, slope, and x and y-intercepts.
Curated OER
Worksheet 14 - Rates
In this rate worksheet, students draw and label given situations, determine the rates and the relationship between them. This two-page worksheet contains 7 multi-step problems.
Curated OER
Linear Functions: Slope, Graphs, and Models
This math packet provides an opportunity for learners to graph two linear equations on a coordinate grid and determine the slope and y-intercept of each. They use the equation of five lines to find the slope and y-intercepts, and then...
Sri Atmananda Memorial School
Rising Water
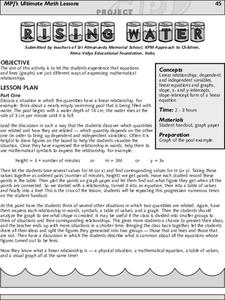
An engaging, and not to mention attractive, lesson plan has prealgebra and beginning algebra scholars examining linear relationships. They consider the rising water level as a swimming pool is being filled. They do so by charting and...
EngageNY
Representations of a Line
Explore how to graph lines from different pieces of information. Scholars learn to graph linear functions when given an equation, given two points that satisfy the function, and when given the initial value and rate of change. They solve...
Curated OER
Y-Intercept and Slope Intercept Form
Alegebra amateurs identify the slope and the y-intercept given a linear equation in slope-intercept form by correctly completing some in class problems. They write the linear equation in slope-intercept form that corresponds to the given...
EngageNY
The Slope of a Non-Vertical Line
This lesson introduces the idea of slope and defines it as a numerical measurement of the steepness of a line. Pupils then use the definition to compare lines, find positive and negative slopes, and notice their definition holds for...
Texas Instruments
Finding Linear Models Part III
Explore linear functions! In this Algebra I lesson, mathematicians graph data in a scatter plot and use a graphing calculator to find a linear regression and/or a median-median line. They use the model to make predictions.
Curated OER
Heart Rate Monitoring
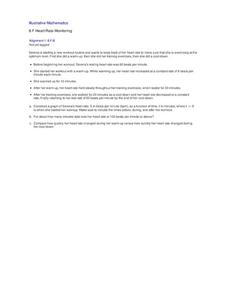
Algebra learners like this resource because it is easy to understand and it relates to their lives. Whether you are starting a new workout routine, or just climbing the stairs, your heart rate increases and decreases throughout the day....
Curated OER
Human Population- Changes in Survival Rates Data Interpretation
In this human population changes in survival worksheet, students interpret and plot data to understand the differences in human mortality and survivorship between historic and modern times. They investigate how these changes influence...
Curated OER
Slope, Vectors, and Wind Pressure
A hands-on lesson using the TI-CBR Motion Detector to provide information to graph and analyze. The class uses this information to calculate the slope of motion graphs and differentiate scalar and vector quantities. There is a real-world...
Illustrative Mathematics
Delivering the Mail
A mail truck travels the same amount of miles per day. It will be up to your algebra learners to find an equation for this mailman’s truck. One needs a good understanding of rate of change and the initial value for this model. The...
Willow Tree
Line Graphs
Some data just doesn't follow a straight path. Learners use line graphs to represent data that changes over time. They use the graphs to analyze the data and make conclusions.
Illustrative Mathematics
Cooking with the Whole Cup
Whoops! Travis accidentally put too much butter into the recipe. Your bakers must find out how to alter the recipe to accommodate different changes by using unit rates and ratios . The activity has multiple parts and calculations with...
Curated OER
Sandia Aerial Tram
Your learners analyze a table of real-life data in order to write an equation that best models the information. Exponential, quadratic, and linear rates of changes are all possibilities in this task.
EngageNY
Linear and Exponential Models—Comparing Growth Rates
Does a linear or exponential model fit the data better? Guide your class through an exploration to answer this question. Pupils create an exponential and linear model for a data set and draw conclusions, based on predictions and the...
EngageNY
Nonlinear Motion
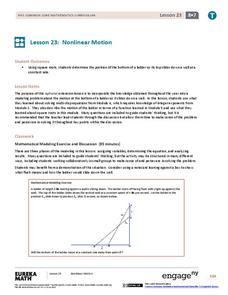
Investigate nonlinear motion through an analysis using the Pythagorean Theorem. Pupils combine their algebraic and geometric skills in the 24th lesson plan of this 25-part module. Using the Pythagorean Theorem, scholars collect data on...
Illustrative Mathematics
Introduction to Linear Functions
Introduce your algebra learners to linear and quadratic functions. Learners compare the differences and relate them back to the equations and graphs. Lead your class to discussions on the properties of a function or a constant slope...
EngageNY
Modeling Linear Relationships
Math modeling is made easy with the first installment of a 16-part module that teaches pupils to model real-world situations as linear relationships. They create graphs, tables of values, and equations given verbal descriptions.
Mathalicious
Been Caught Stealing
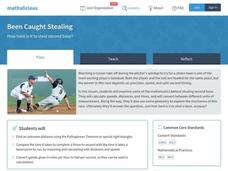
You're safe, when calculating the odds of stealing second base! Learners compare the rate of a runner to the distance the ball travels, in a lesson that explores right triangles and measurement. Full of discussion questions and fun...


