EngageNY
Displaying a Data Distribution
Pupils analyze a display of data and review dot plots to make general observations about the highest, lowest, common, and the center of the data. To finish, learners match dot plots to scenarios.
Curated OER
Student Costs Data Table
Young scholars compare and contrast two routes selected for a virtual field trip. They create a data table of educational activities, lodging, and meal costs using Microsoft Excel software.
Curated OER
Application of Matrix Multiplication
The class explores a real-world application in which the data represents rental prices of beach condos. They problem solve by multiplying matrices to determine the cost of each property in each season. Several scenarios are presented in...
Curated OER
Data Analysis: Infiltration Rate and Composition of Concrete
Students collect and graph data. In this statistics instructional activity, students analyze data using a spreadsheet program. They display their data effectively and analyze it.
Willow Tree
Bar Graphs
Circles, lines, dots, boxes: graphs come in all shapes in sizes. Scholars learn how to make a bar graph using univariate data. They also analyze data using those bar graphs.
Willow Tree
Line Graphs
Some data just doesn't follow a straight path. Learners use line graphs to represent data that changes over time. They use the graphs to analyze the data and make conclusions.
American Statistical Association
How Fast Are You?
Quick! Snap up the instructional activity. Scholars first use an online app to collect data on reaction times by clicking a button when the color of a box changes. They then plot and analyze the data by considering measures of center,...
Bowland
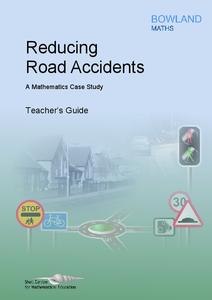
Reducing Road Accidents
By making the following changes to the roads, we can prevent several accidents. A multiple-day lesson prompts pupils to investigate accidents in a small town. Pairs develop a proposal on what to do to help reduce the number of accidents....
Curated OER
Reaction Time
Students record reaction time data and calculate minimum, maximum, mean, median, and mode. They participate in a class reaction time activity, observe and conduct an online experiment, and discuss and analyze the activity results.
Curated OER
Reaction Time
Third graders review important vocabulary to explain measures of central tendency and reaction time. In pairs, they measure reaction time of dropping and catching a ruler. Data is collected after repeated catches and information is...
Curated OER
How Do You Rate?
Fifth graders make a graph. In this pulse rate lesson, 5th graders estimate their pulse and record it. Students measure their pulse while at rest and after physical activity and record it. Students use the internet to graph their results...
Curated OER
Lining Up Data
Students examine the concept of function and make models of data and predictions based on that data.
Curated OER
Keep it Bottled Up: Linear Rates of Pressure Increase
Pupils explore linear functions in this lesson when they collect and analyze data as a chemical reaction proceeds. Learners record pressure versus time data and model the data as a linear function. They also examine the concept of slope...
Curated OER
Murder in the First Degree - The Death of Mr. Spud
Secondary learners investigate exponential functions in a real-world scenario. They collect data on the temperature of a cooling baked potato, enter the data into lists, and graph the data using a scatter plot before finding an...
Curated OER
Heart Smart in a Heart Beat
As an introductory activity, young statisticians measure their heart rate at rest and after exercise and compute the mean and median, and create a box & whisker plot. This is followed by watching a video (that no longer seems to...
Virginia Department of Education
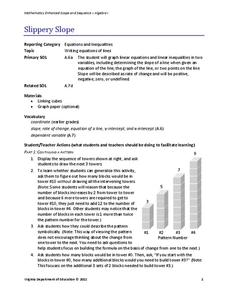
Slippery Slope
Explore slope using geometric patterns. Young mathematicians investigate towers built from cubes to develop a linear pattern. They move the data to a coordinate plane to connect the pattern to slopes.
Curated OER
Mystery Graphs
Young scholars study graphs and learn how to display information into a graph. In this graph lesson plan, students construct a graph of their own sorted data, and pick out things in graphs that are inconsistent.
Curated OER
Rate of Change
Students observe and calculate slopes. In this algebra lesson plan, students graph equations and determine the pace at which the slope is changing. They use the navigator to see the change as they graph the lines around.
Kenan Fellows
Lego Thinking and Building
Run a simulated airplane manufacturing plant with your pupils as the builders! Learners build Lego airplane models and collect data on the rate of production, comparing the number produced to the number defective. Using linear...
Cornell University
Math Is Malleable?
Learn about polymers while playing with shrinky dinks. Young scholars create a shrinky dink design, bake it, and then record the area, volume, and thickness over time. They model the data using a graph and highlight the key features of...
Curated OER
Real Estate Lesson: Monthly Payments
Students examine real-world data relating to real estate. They conduct Internet research, record data regarding real estate in major cities, graph the data, calculate mortgage payments using a mortgage calculator, and analyze the data.
Curated OER
Comparing Linear and Exponential Data
Students graph linear and exponential equations. For this algebra lesson, students differentiate between linear and exponential equations. They relate it to the real world.
Curated OER
Baseball Relationships - Using Scatter Plots
Students use graphing calculators to create scatter plots of given baseball data. They also determine percentages and ratios, slope, y-intercepts, etc. all using baseball data and statistics.
Curated OER
Critter Encounter Chart
Students record data found at an assigned web site. In this data collection lesson, students access an assigned web site in order to complete a data chart about animals they see. They travel to different sections of the web site to find...


