Illustrative Mathematics
Baseball Cards
Here is a resource that demonstrates growth and the initial state of an equation. For this case, your class will be looking at baseball collections. How many baseball cards did the collector start out with, and how many were added or...
Curated OER
Modeling Linear Relationships
Learners graph lines using the slope and y-intercept. In this algebra lesson, students create data using tables and equations. They use their data to make predictions and draw conclusion.
Illustrative Mathematics
High School Graduation
An exercise in finding the approximate time that a name would be called at a graduation. Estimating time may be difficult for some of the class, so this resource would not be a good choice for learning this standard. It does end with a...
EngageNY
Representations of a Line
Explore how to graph lines from different pieces of information. Scholars learn to graph linear functions when given an equation, given two points that satisfy the function, and when given the initial value and rate of change. They solve...
EngageNY
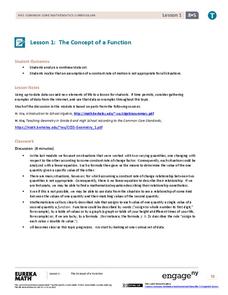
The Concept of a Function
Explore functions with non-constant rates of change. The first installment of a 12-part module teaches young mathematicians about the concept of a function. They investigate instances where functions do not have a constant rate of change.
Curated OER
Buying Coffee
Starbucks or house blend? Pupils analyze the unit rate as the cost per pound of coffee. They use a graph to visualize the unit rate given the cost for a quantity other than one pound.
Howard County Schools
Maria’s Quinceañera
How long will it take to save up for a car? Classmates use linear and exponential models to see how money received during a Quinceanera will grow over time.
Curated OER
Slope as a rate of change
In this Algebra I/Algebra II worksheet, students examine the slope of line as the rate of change between the dependent and independent variables. The one page worksheet contains two multiple choice questions. Answers are included.
Curated OER
Standard Linear Form
Ninth graders identify and describe the x-intercept as the place where the line crosses the x-axis as it applies to football. They create their own differentiations to reinforce the distinction between the x-intercept and the...
Curated OER
Inequalities 7.3
Graph inequalities and discuss the difference in their slopes. Learners observe rate of change as they compare linear, quadratic, and cubic functions.
Curated OER
Applying Properties to Variables
Eighth graders combine like terms in this properties of variables instructional activity. Using named items (stars, moons and hearts), they combine like terms using variables. They use the distributive property to combine like terms....
Texas Instruments
Is It or Isn't It Proportional
How can you tell if number relationships are proportional? Mathematicians investigate proportional relationships. They compare and contrast functions and graphs to determine the characteristics of proportional relationships, as well as...
Curated OER
Lessen the Loan
Middle-schoolers explore the concept linear equations. They use the internet to navigate through videos and problems. Pupils problem solve to determine rates of change, slope, and x and y-intercepts.
Mathematics Common Core Toolbox
Golf Balls in Water
Here's a resource that models rising water levels with a linear function. The task contains three parts about the level of water in a cylinder in relationship to the number of golf balls placed in it. Class members analyze the data and...
Curated OER
Sandia Aerial Tram
Your learners analyze a table of real-life data in order to write an equation that best models the information. Exponential, quadratic, and linear rates of changes are all possibilities in this task.
Curated OER
Rates in Linear Mechanical Systems
Students examine factors that control rates in mechanical system. They identify units associated with speed, calculate speed of moving object, identify units associated with acceleration, and calculate acceleration of moving object.
Curated OER
Polly and the Shapeshifter
Students analyze the patterns in polygons and relate it to the rate of change. In this algebra lesson, students discuss the relationship between the data and the graph of the data.
EngageNY
Increasing and Decreasing Functions 2
Explore linear and nonlinear models to help your class build their function skills. In a continuation of the previous lesson, learners continue to analyze and sketch functions that model real-world situations. They progress from linear...
Inside Mathematics
Squares and Circles
It's all about lines when going around. Pupils graph the relationship between the length of a side of a square and its perimeter. Class members explain the origin in context of the side length and perimeter. They compare the graph to the...
West Contra Costa Unified School District
Point-Slope Application Problems
Create a linear equation for a problem when the intercept information is not given. The two-day lesson introduces the class to the point-slope form, which can be used for problems when the initial conditions are not provided. Pupils...
Mathematics Vision Project
Quadratic Functions
Inquiry-based learning and investigations form the basis of a deep understanding of quadratic functions in a very thorough unit plan. Learners develop recursive and closed methods for representing real-life situations, then apply these...
Willow Tree
Direct and Inverse Variations
Enhance pupil understanding of proportions and variable relationships by studying direct and inverse variation. Use the idea of a proportional relationship to teach direct variation. Then use a similar pattern to help individuals...
Curated OER
Podcasting Parabolas
Students explore parabolas. In this algebra and technology lesson, students construct the equation of a specific parabola, then take digital photos of real-life representations of these parabolas. Students create a podcast with a...
Charleston School District
The Line of Best Fit
If it's warm, they will come! Learners find a line of best fit to show a relationship between temperature and beach visitors. Previous lessons in the series showed pupils how to create and find associations in scatter plots. Now, they...


