Noyce Foundation
Snail Pace
Slow and steady wins the race? In the assessment task, scholars calculate the rates at which different snails travel in order to find the fastest snail. Hopefully, your class will move much more quickly in finishing the task!
Curated OER
Worksheet #3, Derivative Rates, Percent Rate of Change, Chain Rule
In this calculus worksheet, students answer compute the distance of an object from a given point after t seconds when given the formula. They use the chain rule to answer 2 questions. Students compute the derivatives and sketch a graph...
Curated OER
How Fast Is Your Car?
Eighth graders discover the relationship between speed, distance, and time. They calculate speed and represent their data graphically. They, in groups, design a ramp for their matchbox car. The goal is to see who's ramp produces the...
Curated OER
"Measurement in Motion"
Ninth graders examine the rate of motion and changes in motion using a ramp and a rolling object. They conduct the demonstration, determine the average speed, and describe how a moving object can have zero acceleration and deceleration.
Curated OER
Linear Motion
High schoolers are able to build an understanding of linear motion. They are able to define and calculate the speed and acceleration of various objects. Students are able to differentiate betweeen instantaneous speed and average speed....
National Institute of Open Schooling
Chemical Kinetics
Not all chemical reactions happen at the same rate because some, like explosions, occur quickly and some, like rusting, occur over time. Here, learners explore chemical reactions and their rates in the 16th lesson of 36. Through readings...
Curated OER
Linear Equations
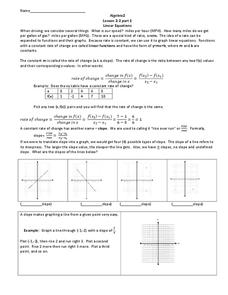
Pre-algebra pupils examine the rate of change and how we can interpret it as a linear function. They are introduced to slope-intercept equations and graphs. Plenty of instruction is provided along with example problems. Note that even...
Curated OER
Physics and Me
Sixth graders compare and contrast mass and weight. In this physics lesson, 6th graders calculate speed given distance and time information. They construct a rocket and relate this to Newton's 3rd Law of motion.
Curated OER
Selling The Molecular Kinetic Theory
Students investigate molecule movement according to the kinetic molecular theory. In this kinetic molecular theory lesson plan, students observe demonstrations showing that molecules speed up with increasing temperature and slow down...
Curated OER
Velocity and Acceleration
Compliment your physics lesson with this PowerPoint which demonstrates many important points regarding acceleration and velocity. A starter experiment activity to stimulate student thinking is given, and may prove very interesting to a...
InqueryPhysics
Interpreting Motion Graphs
Every movement in the world can be measured and even motionless objects can be significant indicators of movement. Focus on motion graphs that feature distance vs. time, speed vs. time, and positive and negative acceleration.
Kenan Fellows
Qualitative Kinetics: Examining the Effect of an Enzyme on a Reaction
Scholars learn about kinetics and buffers as they use qualitative and quantitative methods to understand enzyme rates and buffer capacity. The application of Beer's Law and spectrophotometry solidifies pupils' knowledge in the first of...
Curated OER
Motion and Force
Motion and force vocabulary words are concisely defined in this 13-slide PowerPoint. This is a great slideshow to review prior to a quiz for 5th or 6th grade science. Tip: Send this PowerPoint to your students so they can review it...
Space Awareness
Climate Zones
The climate at the equator is hotter than the climate at the poles, but why? The lesson goes in depth, explaining how the angles of illumination relate to the heating rate at different latitudes and seasons. Scholars use a strong lamp,...
Discovery Education
Cool It!
Adjust the melting time of ice without varying the temperature! Learners experiment with different materials to decide how the materials affect the rate an ice cube melts. They then connect their findings to the conductivity of each...
Curated OER
The Speed of Chemistry
In this rates of chemical reactions worksheet, high schoolers read about the various factors that influence the rate of chemical reactions such as surface area, concentration, temperature and catalysts. Students answer eight questions...
Curated OER
Speeding up the Fizz
Students investigate temperature and chemical reactions. They explore the effect of temperature and particle size has on the rate of a simple chemical reaction. In addition, they graph their results and answer assessment questions.
Curated OER
Tracking Speed
Students collect data for a runner by measuring the time it takes for the runner to run equal distances. After collecting data, students average speeds and accelerations for the runner. Assignment is completed by graphing the data.
Curated OER
Speed Trails
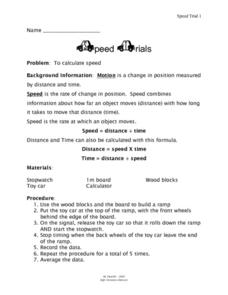
In this Algebra I/Algebra II activity, students conduct an experiment with toy cars in order to calculate and compare average, instantaneous, and constant speed. The two page activity contains three questions. Answers are not included.
Illustrative Mathematics
Molly's Run
A simple lesson with a lot of support behind it. Your learners will find out how long it takes Molly to run a mile by choosing their solution method. The activity can be used as a lesson or as an independent assignment. Preface with...
EngageNY
Comparing Linear Functions and Graphs
How can you compare linear functions? The seventh installment of a 12-part module teaches learners how to compare linear functions whose representations are given in different ways. They use real-world functions and interpret features in...
Balanced Assessment
Multi-Graphs
So many things change as time goes by. Here, scholars create graphs based on this premise. Each problem asks pupils to sketch a graph that describes a given situation. Their graphs represent various characteristics such as height,...
Curated OER
A Steep Hike
Students explore slope. In this middle school mathematics lesson, students analyze and interpret graphs as they investigate slope as a rate of change. Students use a motion detector to collect data as they walk at different speeds and...
Curated OER
The Wheels on the Bot Go Round and Round, Part I
Students determine how speed is measured. In this physics lesson, students design an experiment to find out if the robot's drive wheel size affects its speed. They collect data and discuss results.


