Curated OER
Learning to Read Graphs
What is your favorite pet? This is a great tool for youngsters just learning how to read and interpret graphs. There are four simple questions. Consider extending this activity by creating a class bar graph: how many learners have a dog,...
Curated OER
Reading Graphs
Encourage kids to read line graphs with confidence using these examples and accompanying comprehension questions. Learners examine two graphs and answer four questions about each. This is definitely intended for beginners to this type of...
Jude Mphoweh
Graphs
Searching for worksheets to include in an elementary math series on bar graphs? Then look no further! This collection of materials has exactly what you need to ensure that your students get plenty of practice reading and analyzing...
Mathed Up!
Distance Time Graphs
If only there was a graph to show the distance traveled over a period of time. Given distance-time graphs, pupils read them to determine the answers to questions. Using the distance and time on a straight line, scholars calculate the...
Curated OER
Double Bar Graphs - Homework 7.1
Your learners have seen basic bar graphs, but do they have experience reading double bar graphs? This worksheet details how to draw a double bar graph and provides an example with six accompanying questions. The final question asks...
Curated OER
Make and Read a Picture Graph
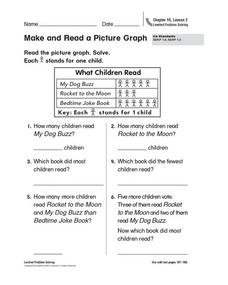
What books do you like? Have your learners read and interpret a picture graph detailing a fictional class's favorite books. Consider conducting a survey of your learners' favorite books and plotting the results as a class!
Curated OER
Reading and Sketching Graphs
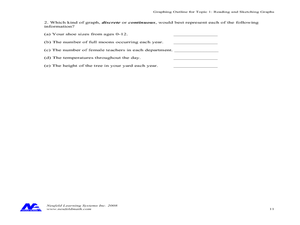
In this graphs worksheet, students answer 15 multistep questions about graphs. Students determine distance traveled, time, velocity, and create scenarios to fit the graph.
Curated OER
Interpreting A Line Graph - Practice Problems 15.3
In this interpreting a line graph worksheet, students read a graph and answer a question. Students are taken through the problem solving process by being asked to understand, plan, solve and look back at the end of the worksheet and...
Curated OER
Use a Graph
Information is often presented in graph form. Can your youngsters read a basic bar or picture graph? Six word problems accompany three graphs. One graph is a bar graph and the other two are pictographs.
Curated OER
Read the Table Graph
For this reading the table graph worksheet, students read the graph and answer questions. In this short answer worksheet, students write answers to four questions.
Curated OER
Learning to Read Graphs 2
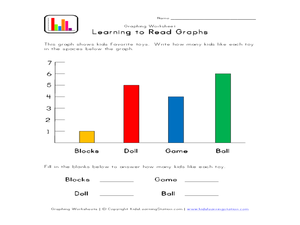
Do you like playing with blocks, dolls, games, or balls? Use this basic graph to review bar graphs with young learners. After completing the four questions below, consider creating your own class graph: who likes blocks the best? Who...
Inside Mathematics
Vencent's Graphs
I like algebra, but graphing is where I draw the line! Worksheet includes three multiple-part questions on interpreting and drawing line graphs. It focuses on the abstract where neither axis has numbers written in, though both are...
EngageNY
Geometric Interpretations of the Solutions of a Linear System
An intersection is more than just the point where lines intersect; explain this and the meaning of the intersection to your class. The 26th segment in a 33-part series uses graphing to solve systems of equations. Pupils graph linear...
Curated OER
Quiz: Reading and Making Line Plots
In this reading and making line plots worksheet, students create a line plot for given sets of numbers. In addition, they read graphs and interpret the average. This one-page worksheet contains ten problems.
Curated OER
Graphs: Students in Math Classes
Are your second and third graders just beginning to read bar graphs? This graph looks at the number of learners present in a math class Monday-Friday. Learners look for basic information, and the graph is easy to read.
Math Mammoth
Circles Graphs and Percents
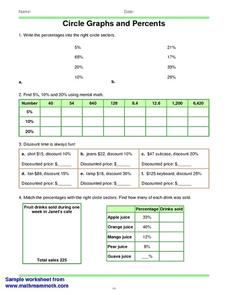
For this percent instructional activity, students read and interpret circle graphs. They determine discounts, and match percentages with circle sectors. This one-page instructional activity contains approximately 30 problems.
Curated OER
My Test Book: Reading Graphs
In this online interactive math skills instructional activity, students solve 10 multiple choice math problems that require them to read and interpret graphs. Students may view the correct answers.
Curated OER
My Test Book: Reading Graphs
In this online interactive math skills worksheet, learners solve 10 multiple choice math problems that require them to read and interpret graphs. Students may view the correct answers.
Curated OER
Read a Picture Graph
It's the Bears vs. the Seals! Who is the season winner? Read this data and have your math class answer the six questions that follow. Consider graphing the chart as a class, or encouraging individuals to graph it before answering the...
California Academy of Science
California's Climate
The United States is a large country with many different climates. Graph and analyze temperature and rainfall data for Sacramento and Washington DC as you teach your class about the characteristics of Mediterranean climates. Discuss the...
Curated OER
Reading and Interpreting Graphs
In this reading and interpreting graphs worksheet, students answer 8 word problems that involve reading information from a graph about pizzas. Students then review a second graph centered on music and answer 12 questions.
Curated OER
Regents High School Examination: Living Environment 2009
Emerging ecologists need a full understanding of life, from the inner workings of a cell to the complex relationships among organisms. This examination is meant to assess high schoolers after an entire year course on the living...
Curated OER
Graphs - Online Activity
In this interpreting graphs worksheet, students complete an on-line activity in which they read both a line graph and a bar graph. They answer questions about how many of each letter is shown on a line graph and how many of each child's...
Curated OER
Reading and Interpreting Graphs Worksheet
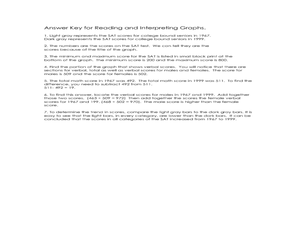
In this bar graphs worksheet, students read and interpret a bar graph on SAT scores by answering short answer questions. Students complete 7 questions total.


