Curated OER
Interpreting Data from Birdfeeders
What kinds of birds live in your area? Read a book about birds to your learners and explore their feeding patterns. Charts and graphs are provided in this three page packet, but consider assigning the basic questions if using with young...
Achieve
Rabbit Food
Keep your pets slim, trim, and healthy using mathematics! Pupils use a linear programming model to optimize the amount and type of food to provide to a pet rabbit. They model constraints by graphing inequalities and use them to analyze a...
Shodor Education Foundation
Plop It!
Build upon and stack up data to get the complete picture. Using the applet, pupils build bar graphs. As the bar graph builds, the interactive graphically displays the mean, median, and mode. Learners finish by exploring the changes in...
National Security Agency
What’s Your Coordinate?
Your middle schoolers will show what they know with their bodies when they become the coordinate plane in this conceptual development unit. Starting with the characteristics of the coordinate plane, learners develop their skills by...
Curated OER
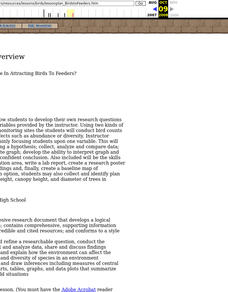
What Factors Contribute In Attracting Birds To Feeders?
Students develop their own research questions dealing with specific variables provided by the instructor; students conduct bird counts using two kinds of birdseed, and analyze possible effects such as abundance or diversity.
Pingry School
Gas Pressure and Temperature Relationship
Humans tend to huddle together when cold and move around more when warm, but do gas particles follow the same pattern? Scholars use a temperature probe, a pressure sensor, and air to study the relationship between temperature and gas...
Virginia Department of Education
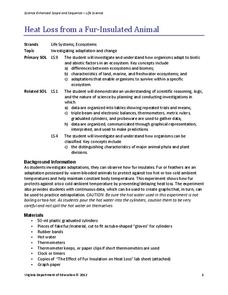
Heat Loss from a Fur-Insulated Animal
How do animals adapt to weather changes? Provide your class with the ability to understand adaptations and body temperature as they participate in this hands on experiment, using fake fur and hot water. Pupils collect data and...
National Institute of Open Schooling
The Gaseous State
Sixth in a series of 36, this lesson focuses on gases and their behavior in given situations. Learners review the states of matter and then focus on gases, specifically learning Boyle's, Charles's, Avogadro's Laws, Dalton's, and Graham's...
Howard Hughes Medical Institute
Got Lactase? Blood Glucose Data Analysis
Many physicals include a blood glucose test, but what are doctors actually testing? Scholars graph and interpret blood glucose data, allowing them to observe the differences in lactase persistence and draw conclusions. They then connect...
NOAA
Subduction Zones
Sink into an interactive learning experience about subduction zones! Junior oceanographers examine the earth-shaking and earth-making effects of subduction in the fourth installment in a 13-part series. Hands-on activities include...
CK-12 Foundation
Flashlight
In a simple circuit, does electricity start instantly? A simulation encourages thinking about the flow of electrons at a microscopic level. Pupils control the voltage, resistance, and switch in order to observe the change in both ideal...
Curated OER
Effects of chemical use in Agriculture
Students research environmental data to create a bar graph. In this agricultural ecology instructional activity, students research the pros and cons of chemical use in farming. Students debate on passing a law to reduce chemical use.
Curated OER
Pizza Possibilities
Students create and interpret line plots, bar graphs, and circle graphs. The lesson assumes mastery of conversions from fraction to decimal to percent, construction of angles, and at least an introduction to graphs displaying data.
Curated OER
Curious Clouds
Second graders explore clouds. They read The Cloud Book by Tomie dePola. Students sort the cloud pictures into three categories. Students create a graph using the cloud pictures. They use Excel to create a bar graph.
Curated OER
The Hudson's Ups and Downs
Even rivers have tides. Older elementary schoolers will discuss the Hudson River and how weather, water craft, and the ocean cause tidal fluctuation. They will examine a series of line graphs that depict tidal fluctuation, then analyze...
Curated OER
What are Igneous Rocks and How are They Formed?
Crystals form before your very eyes! What sixth grader wouldn't enjoy this lesson on igneous rock formation? Using hot Salol, junior geologists observe the crystal formation process as the material cools. This comprehensive lesson plan...
Curated OER
Population Ecology
A complete study of population ecology is covered by this worksheet. Biology or ecology learners answer questions and interpret population graphs. This can be used as the intended guided notes worksheet or assigned as homework.
Curated OER
Enzymes at Work
The first four questions on this assignment require the use of critical thinking skills to apply the action of enzymes to different situations. Biologists then interpret enzyme activity data in a table and answer questions about it. This...
Curated OER
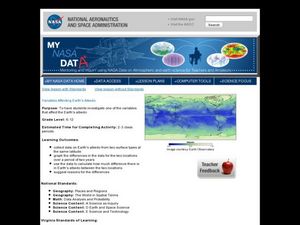
Variables Affecting Earth's Albedo
Students study the variables that affect the Earth's albedo. In this environmental data analysis lesson students interpret and graph information and calculate changes.
Curated OER
Regents High School Examination PHYSICAL SETTING CHEMISTRY 2007
The University of the State of New York has designed a series of exams to be given to high schoolers. This chemistry exam is one of the most comprehensive and well-written that you will ever find. It consists of 84 questions in a variety...
Curated OER
Settlement Exploration: Then and Now
NASA has crafted an imaginative and memorable series of lessons, "NASA and Jamestown Education Module." This lesson is one of the five components. In it, middle schoolers connect history and science by comparing the settlement of...
Curated OER
Investigating Brass Instruments and Pitch
Students observe the sounds of different brass instruments in order to understand how to create different pitches. In this musical instructional activity, students create a "brass" instrument from everyday household objects. The students...
Noyce Foundation
Truffles
Knowing how to scale a recipe is an important skill. Young mathematicians determine the amount of ingredients they need to make a certain number of truffles when given a recipe. They determine a relationship between ingredients given a...


