Curated OER
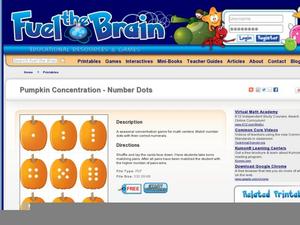
Pumpkin Concentration - Number Dots
This worksheet provides a downloadable template for a seasonal concentration game. Groups of learners match the dots on pumpkin cards. Related printables provide a template for Pumpkin Concentration with number words. Concept could be...
Curated OER
Comparing and Ordering Fractions, Mixed Numbers, and Decimals
Create your own fraction kits by folding and labeling paper using fraction vocabulary. Learners then work in groups to use these in comparing and sequencing both whole numbers and fractions. They also create unit cubes and develop an...
Curated OER
One to One Functions
In this one to one functions worksheet, students solve 27 short answer and graphing problems. Students determine if a function is one to one given a graph or an equation. Students graph functions to determine if it is one to one.
Curated OER
Sets, Relations, and Functions
Sets, relations, functions, and graphing linear equations are practiced in this challenging learning exercise. The class determines if a relation is a function or not and find the functional value of a domain element. The one page...
Ohio Department of Education
Describing and Creating Plane Figures - Grade One
Young mathematicians draw, create, and describe different shapes using triangles. They discuss attributes of the original and created shapes. Pupils classify the created shapes and draw and write in mathematics journals to communicate...
Texas Instruments
Graphing Calculator Investigation Graphs of Relations
Learners investigate relations in this algebra lesson. They graph the set of ordered pairs that determine a relation. Using a TI-83 Plus, your learners will enter the coordinates in a list, create a scatter plot, and manipulate the...
Curated OER
Linear Relations
In this linear relations worksheet, students complete a table for given functions. They classify graphs as linear or non-linear. Students graph given equations. They compare and contrast graphs. This nine page worksheet contains five...
Curated OER
Number facts
For this number facts worksheet, students determine the number associated with each of the twenty-five facts provided. Students then need to determine how the answers are related to each other. Answers are provided at the end of the...
Inside Mathematics
Functions
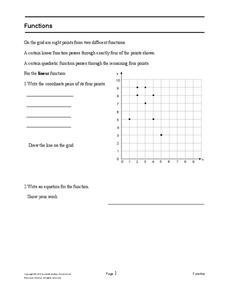
A function is like a machine that has an input and an output. Challenge scholars to look at the eight given points and determine the two functions that would fit four of the points each — one is linear and the other non-linear. The...
Concord Consortium
Dubious Dice
How many ways can you slice dice distribution? A short performance task asks pupils to consider different types of distributions. Given histograms showing a triangular distribution and a bimodal distribution, they create pairs of dice...
Teach Engineering
Coordinates and the Cartesian Plane
The plot thickens to get a functional understanding. After a short review of plotting points on the coordinate plane, class members learn the difference between functions and relations in the second lesson in a series of nine. They show...
CCSS Math Activities
Smarter Balanced Sample Items: 8th Grade Math – Target E
One of several presentations of eighth grade sample items looks at the basics of functions. Smarter Balanced sample items for Target E highlights the way function content shows up on the assessments. The presentation contains eight items...
Mathematics Assessment Project
Functions
After identifying which of the given coordinate points fall on the graph of a line and which fall on the graph of a parabola, pupils write equations for each function.
Shodor Education Foundation
Scatter Plot
What is the relationship between two variables? Groups work together to gather data on arm spans and height. Using the interactive, learners plot the bivariate data, labeling the axes and the graph. The resource allows scholars to create...
Virginia Department of Education
Give or Take a Few
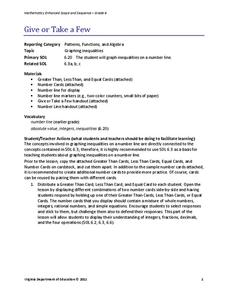
Young mathematicians extend their knowledge of rational numbers on a number line to graph inequalities by first using number cards to compare rational numbers. They finish by using similar reasoning to graph inequalities on a number line.
EngageNY
Problem Solving When the Percent Changes
Use more than one whole to solve percent problems. The ninth installment in a 20-part series has pupils work percent problems in which they must determine two wholes. Individuals use double number lines to represent and solve the...
Curated OER
Relations
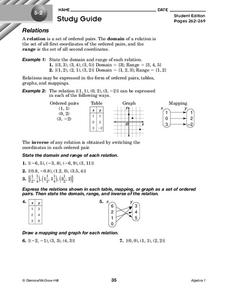
In this relations worksheet, 10th graders solve and complete 7 different problems that include defining various relations of number sets. First, they state the domain and range of each relation. Then, students express the relations shown...
Curated OER
Equations as Relations
In this equations as relations worksheet, 9th graders solve and complete 8 different problems that include writing equations as relations. First, they determine the ordered pairs that are solutions for each given equation. Then, students...
Curated OER
What Makes Ten
Students investigate the concept of ten and how it is part of the real number system. They find the quantity of ten using as many combinations as possible. They can count using manipulatives, write on paper, or by doing mental math.
Curated OER
Equations from Unit Rates
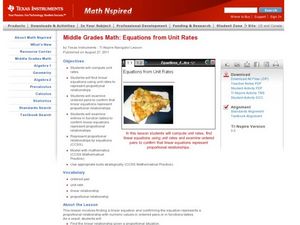
Your class can become linear equations masters, as they calculate the rate of change of a function. They observe different types of coordinates as they relate to a graph, then use the Ti-navigator to move the line around and draw...
Math Solutions
Factor Game
Learning about factors and multiples is all fun and games with this simple math activity. The lesson begins with the teacher and class playing the Factor Game together as students figure out the rules and uncover key vocabulary as they...
Virginia Department of Education
Similar Triangles
Pupils work in pairs to investigate what it takes to prove that two triangles are similar. They work through various shortcuts to find which are enough to show a similarity relationship between the triangles. Small groups work with the...
West Contra Costa Unified School District
Introduction to Inverse Functions
Ready to share the beauty of the inverse function with your classes? This algebra II lesson guides the discovery of an inverse function through a numerical, graphical, and an algebraic approach. Connections are made between the three,...
EngageNY
Interpreting the Standard Deviation
Does standard deviation work for non-symmetrical distributions, and what does it mean? Through the use of examples, high schoolers determine the standard deviation of a variety of distributions and interpret its meaning. Problems require...


