Curated OER
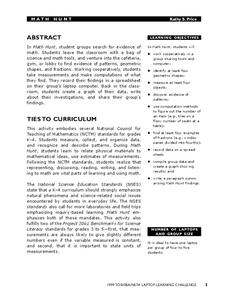
Math Hunt
Go on a scavenger hunt around your school to find evidence of math. Investigate different areas of your school for patterns, fractions, and different geometric shapes. Finally, create a spreadsheet and plot the data you've collected.
Curated OER
M&Ms Count and Crunch
Middle schoolers practice skills involving statistics and probability by making predictions on number of each color candy in one pound bag of M&Ms. They record both guesses and actual quantities, calculate percentages, and create bar...
Curated OER
Understanding Weather and Climate Patterns
Learners research the climate patterns of various locations and make predictions based on their findings. They determine the importance of latitude and longitude in weather and climate. Students create graphs displaying their collected...
Curated OER
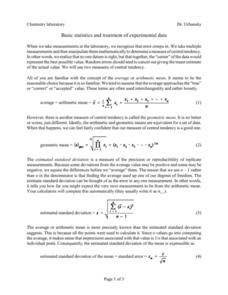
Basic Stats
In this chemistry worksheet, young scholars focus upon the concepts of mean and standard deviation and how it is used in the laboratory to interpret data.
Illustrative Mathematics
How Many Buttons?
Bring the class into the probability by having everyone count buttons on their shirts. Organize the data into the chart provided and chose different possibilities such as "female with one button" or "all students with more than four...
Curated OER
Birds' Eggs
More than just data, scatter plots are full of information that can be used to answer a variety of questions. This lesson uses a plot with information about bird egg sizes to answer questions about the relationship between length and...
Achieve
False Positives
The test may say you have cancer, but sometimes the test is wrong. The provided task asks learners to analyze cancer statistics for a fictitious town. Given the rate of false positives, they interpret the meaning of this value in the...
NOAA
A Quest for Anomalies
Sometimes scientists learn more from unexpected findings than from routine analysis! Junior oceanographers dive deep to explore hydrothermal vent communities in the fourth lesson in a series of five. Scholars examine data and look for...
PBS
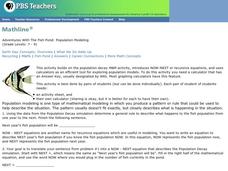
Adventures With The Fish Pond: Population Modeling
Build up from the previous activity where your learners charted the population growth and decay of a fish pond with M&Ms®. Have them look at the data from that activity and create a Now-Next, or recursive equations, to predict the...
Museum of Tolerance
Where Do Our Families Come From?
After a grand conversation about immigration to the United States, scholars interview a family member to learn about their journey to America. They then take their new-found knowledge and apply their findings to tracking their family...
Los Angeles County Office of Education
Assessment For The California Mathematics Standards Grade 4
Have scholars show what they know with a 20-page assessment aligned to the California State Standards. The test covers concepts such as large and whole numbers, all four mathematical operations, fractions, decimals, geometric figures,...
Curated OER
It Has Been Rubbish For Years
Students are presented with the problems of percentages and focus upon numbers in contrast to 100. They calculate problems with money and are engaged with the use of games as a teaching tool. Students also interpret data as presented in...
Curated OER
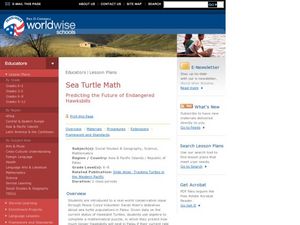
Sea Turtle Math
Students consider the future of endangered species. For this conservation lesson, students view a slide show and use mathematical data to construct a prediction for the survival of an endangered species. This lesson includes, personal...
Curated OER
The Three M's of Statistics: Mode, Median, Mean
Young mathematicians use the Visual Thesaurus to define mean, median, and mode. In this mean, median and mode lesson, learners use online sources to find the definitions of mean, median, and mode before applying the concepts to a class...
Curated OER
Mean, Median and Mode (II)
In this mean instructional activity, middle schoolers examine given information and determine the mean, mode and median of data. This one-page instructional activity contains 10 problems. Answers are provided.
University of Colorado
Distance = Rate x Time
Every year, the moon moves 3.8 cm farther from Earth. In the 11th part of 22, classes use the distance formula. They determine the distance to the moon based upon given data and then graph Galileo spacecraft data to determine its movement.
Alabama Learning Exchange
Bloodstain Pattern Doesn't Lie......
An interesting instructional activity on hypothesizing about the diameter of a drop of blood that is splattered. To test their theories, learners work in groups to make blood droplets splatter from different heights. They use graphed...
Q Continuum
Planets
Have you ever looked up at the night sky and wondered what constellation you were seeing or whether that bright object was a star or a planet? Are you searching for the best tilt-to-view constellation and planet app that money can't buy?...
Curated OER
US Population 1790-1860
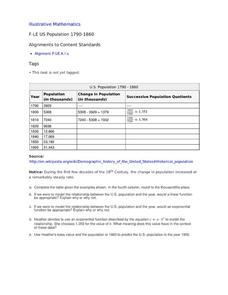
Your young population scientists analyze a table of values, write a model to represent the real life data, finish the table of data and predict future populations in a collaborative, real-life activity.
Chymist
Empirical Formula of a Compound
Because of the work of John Dalton, we are able to write formulas for compounds. The hands-on experiment has scholars prepare a compound from its elements. Using mass data, individuals write the empirical formula for the compound.
Inside Mathematics
Vencent's Graphs
I like algebra, but graphing is where I draw the line! Worksheet includes three multiple-part questions on interpreting and drawing line graphs. It focuses on the abstract where neither axis has numbers written in, though both are...
EngageNY
Graphs of Exponential Functions
What does an exponential pattern look like in real life? After viewing a video of the population growth of bacteria, learners use the real-life scenario to collect data and graph the result. Their conclusion should be a new type of...
Curated OER
The Greenhouse Effect
Why does it get so hot inside of our cars in the summertime? The greenhouse effect! Lab groups experiment to see what happens to an ice cube enclosed in a jar and placed in sunlight as compared to an ice cube outside of the jar. They...
Curated OER
Systems of Linear Equations
Introduce the inverse matrix method to solve systems of linear equations both algebraically and graphically. Using given data, your class checks their answers with graphing calculators. Handouts are included in this well-thought out lesson.
