Curated OER
Warm up to the Gulf Stream
Students find out the temperature difference between the Gulf Stream and the surrounding water. They locate the Gulf Stream on the infrared image of the eastern seaboard of the US.
Curated OER
Sunspots: Correlating Sunspots to Active Regions
Students investigate sunspots. They use solar imaging from satellite instruments which are currently circling the sun. Students compare images from the satellites and determine the existence of a correlation between the two types of...
Curated OER
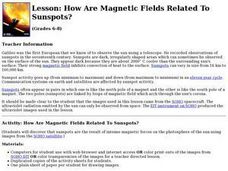
How Are Magnetic Fields Related To Sunspots?
Middle schoolers discover that sunspots are the result of intense magnetic forces on the photosphere of the sun by observing images from the SOHO satellite.
Curated OER
Sea Surface Temperature Trends of the Gulf Stream
Students use authentic satellite data to produce plots and graphs of sea surface temperature as they explore the seasonal changes of the Gulf Stream.
Curated OER
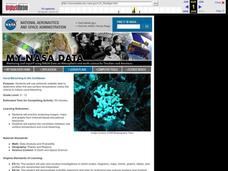
Coral Bleaching in the Caribbean
Students use authentic satellite data on the NASA website to determine when the sea surface temperature meets the criteria to induce coral bleaching.
Curated OER
Exploring the Aral and Salton Seas
Learners investigate the environments of the Aral and Salton Seas. They use images taken from the space shuttle, the U2 spy planes, and remote sensing satellites to learn more about what is happening in each region. Students discuss the...
Curated OER
Using My Nasa Data To Determine Volcanic Activity
Young scholars use NASA satellite data of optical depth as a tool to determine volcanic activity on Reunion Island during 2000-2001. They access the data and utilize Excel to create a graph that has optical depth as a function of time...
Curated OER
Antarctic Jukebox
In this environment worksheet, students read an excerpt about Antarctica, including the many challenges explorers face. Then they imagine that they are a sound recordist in Antarctica and record 3 CDs. Students look at the images given...
Curated OER
Paint By The Numbers
Students, in groups, explore how astronomical spacecraft and computers create images of objects in space.
Curated OER
Pixel Transmission
Students develop code systems to transmit information between groups. They explore, explain and apply techniques used to transmit remote sensing data to better understand remote sensing images.
Curated OER
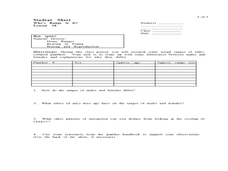
Who's Range is it?
Students investigate the habits of panthers by analyzing radio transmitted data. In this animal life lesson plan, students utilize computers to view the range of different statistics dealing with Florida panthers. Students...
LABScI
Viscosity: The Fluid Lab
There's more to fluids than meet the eye—they include gases, liquids, and polymers, too! Scholars complete three hands-on activities exploring different properties of fluids. They explore viscosity by measuring the resistance, or...
Curated OER
Geography: Snow Cover on the Continents
Students create maps of snow cover for each continent by conducting Internet research. After estimating the percentage of continental snow cover, they present their findings in letters, brochures or Powerpoint presentations.
National History Day
“Saving the Bear”: The Russian Expeditionary Force of World War One
How have Russian politics affected countries on a global stage? The discussion of the Russian Revolution and World War I begins with an analysis of primary resource letters. Learners finish with a project where they create a timeline of...
Curated OER
Understanding Light: Lesson 2 - The Electromagnetic Spectrum
Students investigate the Electromagnetic Spectrum and realize there is energy beyond visible light. They identify parts of the EM Spectrum.
Polar Trec
Global Snow Cover Changes
Snow is actually translucent, reflecting light off its surface which creates its white appearance. Pairs or individuals access the given website and answer questions about snow cover. They analyze graphs and charts, examine data, and...
Curated OER
Gotham Equinox
By looking at the direction of the parallel streets of New York and figuring which days the setting sun is directly visible along those lines, your class can calculate the degree and angle of the sun. A really nice lesson, giving a...
Curated OER
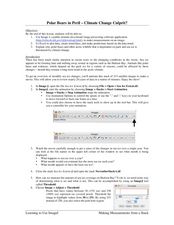
Polar Bears in Peril - Climate Change Culprit?
Students explore the changes in sea ice over several years. In this life science lesson plan, students review and examine 20 years of data. They use Excel to graph data and analyze trends.
Curated OER
The Hajj: Muslim Pilgrimage in a Geographic Perspective
Young scholars read information on the Hajj. They discuss pilgrimage and ways it differs from going to a church, mosque or synagogue. Students discuss logistical problems that might be posed for the host country of a pilgrimage. Young...
Curated OER
Plate Tectonics Day 3 Sea Floor Spreading: Evidence for Continental Drift
Students are introduced to Sea Floor Spreading and how it provides evidence for Hess's and Deitz's theory of Continental Drift. They use paleomagnetic data to calculate the rate of Sea Floor Spreading.
National Endowment for the Humanities
Lesson 3: On the Road with Marco Polo: From Hormuz to Kashgar
Young explorers examine the route that Marco Polo and his father traveled to reach China. They examine online maps of the Silk Road and harsh terrain of Afghanistan to determine challenges that may have been encountered during travel.
Curated OER
Map Puzzles
Young scholars make puzzles from world maps, dramatizing how much of the globe is covered by ocean.
Curated OER
A Contouring We Go
Students examine the built environment and infrastructures of their community by constructing contour equipment, using the equipment, and comparing their results to current topographical maps of the same area
Curated OER
Solving the Puzzle
Students create a map showing the United States borders at a specific period in history and produce three questions to be answered by examining the map. They also write a productive paragraph explaining who, what, when, where, how/why a...
Other popular searches
- Satellite Imagery
- Hurricane Satellite Images
- Infrared Satellite Imagery
- Image Satellite
- Aerial and Satellite Imagery
- Satellite Images of Erosion
- Science Satellite Imagery
- Satellite Imagery Weather Maps
- Octagonal Image Satellite


