Shodor Education Foundation
Scatter Plot
What is the relationship between two variables? Groups work together to gather data on arm spans and height. Using the interactive, learners plot the bivariate data, labeling the axes and the graph. The resource allows scholars to create...
Shodor Education Foundation
Incline
Study velocity while examining graphical representations. As scholars work with the animation, they discover the effect the height of an incline has on the velocity of the biker. They make conclusions about the slope of the line in terms...
Kenan Fellows
Saving Those Who Save Us: Exploring the Use of Sensors with Data Visualization
Sensor technology is amazingly accurate and useful. Combining the sensor technology and mathematical knowledge, scholars design experiments to answer a question they have developed. Questions may focus on light sensing, temperature...
Curated OER
Point Graphs
Learners experiment with point graphs. For this math lesson, students are divided into groups and perform an experiment to see how high a ball bounces, recording their results on a point graph. Learners then answer provided questions.
Curated OER
Impact!!
Pupils perform a science experiment. In this algebra lesson, students collect data from their experiment and create a graph. They analyze the graph and draw conclusion.
Curated OER
Filling the Glass (Water, Air, and Fractions)
Learners predict which of two glasses is 1/2 full using visual estimation, height measurement, and liquid measurement methods. Mathematical equations to accurately solve the problem are determined and verified.
Shodor Education Foundation
Linear Inequalities
An interactive lesson helps individuals learn to graph inequalities in two variables. Scholars can adjust the interactive to present the inequalities in standard or slope-intercept form.
Teach Engineering
Equal and Opposite Thrust in Aircraft: You're a Pushover!
It's the law—every action requires a reaction, no matter how small. Pupils experience two demonstrations of Newton's third law of motion as it relates to thrust in the 10th segment of a 22-part unit on flight. Using their mathematical...
Curated OER
Which Tape is Stickiest?
Students conduct an experiment to determine which style of tape will stick the best. In this controlled experiment lesson plan, students predict which tape will stick best to a marble that rolls over it, then they conduct the experiment...
Shodor Education Foundation
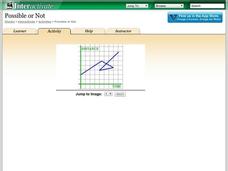
Possible or Not?
What does the graph mean? Pupils view 10 graphs and determine whether they are possible based on their contexts. The contexts are distance versus time and profit versus time.
Shodor Education Foundation
Equation Solver
Solve your equation and prove it, too. Young mathematicians solve linear equations using an interactive. They must input a property to justify each step of their solutions.
Curated OER
Analyzing Birds and Planes
Students find a variety of topics and subjects in this lesson. In the math section of this lesson, students graph linear equations and analyze their data. They solve one and two step equations to find the variable.
Shodor Education Foundation
Algebra Quiz
Reviewing the process of solving equations is as easy as one click of a button. Scholars solve linear and quadratic equations by using a helpful interactive. The computer app automatically scores responses, providing immediate feedback...
Achieve
BMI Calculations
Obesity is a worldwide concern. Using survey results, learners compare local BMI statistics to celebrity BMI statistics. Scholars create box plots of the data, make observations about the shape and spread of the data, and examine the...
Curated OER
Can you Find the Expression
Students collect data from measurements and weights for this experiment. In this algebra lesson, students analyze graphs they create form their data to find the expression representing the data. They label which graph provided the best...
Curated OER
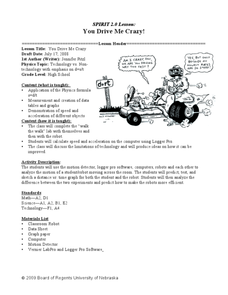
You Drive Me crazy
Students calculate the distance and acceleration of an object. In this algebra lesson, students collect data and create table and graphs to analyze it. They complete a lab as they collect and analyze data on acceleration and distance.
Shodor Education Foundation
Multiple Linear Regression
You'll have no regrets when you use the perfect lesson to teach regression! An interactive resource has individuals manipulate the slope and y-intercept of a line to match a set of data. Learners practice data sets with both positive and...
Achieve
Rabbit Food
Keep your pets slim, trim, and healthy using mathematics! Pupils use a linear programming model to optimize the amount and type of food to provide to a pet rabbit. They model constraints by graphing inequalities and use them to analyze a...
Illustrative Mathematics
Sammy's Chipmunk and Squirrel Observations
Here is a fun project. Sammy observes a chipmunk and a squirrel to see how many holes each needs in order to stash the same number of acorns. Scholars could find the answer algebraically or create a table to analyze the problem in...
Curated OER
Celsius to Fahrenheit
Students convert degrees between two different units. In this algebra lesson plan, students graph linear equations and identify the line of best fit. They use their line of best fit to make predictions given a set of data.
Curated OER
Composting
Eighth graders collect data from Bottle Biology compost columns and record using Excel spreadsheet.


