Inside Mathematics
Graphs (2007)
Challenge the class to utilize their knowledge of linear and quadratic functions to determine the intersection of the parent quadratic graph and linear proportional graphs. Using the pattern for the solutions, individuals develop a...
Illustrative Mathematics
Who Has the Best Job?
Making money is important to teenagers. It is up to your apprentices to determine how much two wage earners make with their after school jobs. Participants work with a table, an equation, and a graph and compare the two workers to see...
Illustrative Mathematics
Telling a Story With Graphs
Turn your algebra learners into meteorologists. High schoolers are given three graphs that contain information about the weather in Santa Rosa, California during the month of February, 2012. Graph one shows temperatures, graph two...
EngageNY
The Line Joining Two Distinct Points of the Graph y=mx+b Has Slope m
Investigate the relationship between the slope-intercept form and the slope of the graph. The lesson plan leads an investigation of the slope-intercept equation of a line and its slope. Pupils realize the slope is the same as the...
EngageNY
There is Only One Line Passing Through a Given Point with a Given Slope
Prove that an equation in slope-intercept form names only one line. At the beginning, the teacher leads the class through a proof that there is only one line passing through a given point with a given slope using contradiction. The 19th...
EngageNY
Some Facts About Graphs of Linear Equations in Two Variables
Develop another way to find the equation of a line. The instructional activity introduces the procedure to find the equation of a line given two points on the line. Pupils determine the two points from the graph of the line.
West Contra Costa Unified School District
Slope-Intercept Sort
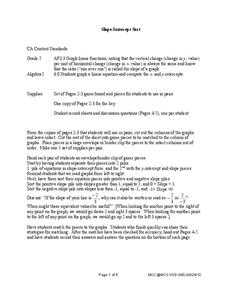
What's so special about slope? Pupils first match cards with slope and y-intercept to graphs of linear equations. They continue the lesson by matching equations in slope-intercept form to the same graphs.
West Contra Costa Unified School District
Sneaking Up on Slope
Pupils determine the pattern in collinear points in order to determine the next point in a sequence. Using the definition of slope, they practice using the slope formula, and finish the activity with three different ways to determine the...
West Contra Costa Unified School District
Discovering Slope of a Line in Standard Form
From start to finish this skills practice resource provides a way for individuals to explore the standard form equation of a line. Begin with a warm-up, work through the problems, and then discover the relationship between the equation...
West Contra Costa Unified School District
Point-Slope Application Problems
Create a linear equation for a problem when the intercept information is not given. The two-day lesson introduces the class to the point-slope form, which can be used for problems when the initial conditions are not provided. Pupils...
EngageNY
Two Graphing Stories
Can you graph your story? Keep your classes interested by challenging them to graph a scenario and interpret the meaning of an intersection. Be sure they paty attention to the detail of a graph, including intercepts, slope,...
Charleston School District
Graphs of Linear Functions
What does a slope of 2/3 mean? Develop an understanding of the key features of a linear function. Pupils graph the linear functions and explain the meaning of the slope and intercepts of the graphs.
EngageNY
The Graph of a Linear Equation in Two Variables Is a Line
Show your class that linear equations produce graphs of lines. The 20th segment in a unit of 33 provides proof that the graph of a two-variable linear equation is a line. Scholars graph linear equations using two points, either from...
Kenan Fellows
Using Motion Sensors to Explore Graph Sketching
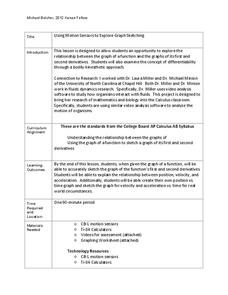
Get moving to a better understanding of graphs of derivatives. Using motion sensors, scholars vary their velocities to create graphs of the first derivative of a function. The activity challenges groups to first create a script of the...
Flipped Math
Calculus AB/BC - Sketching Graphs of Functions and Their Derivatives
Find deeper meaning in graphs. Pupils use the knowledge gained from the previous sections in the unit to sketch graphs of a function's derivative. Learners also see how to sketch a graph of a function given the graph of its derivatives....
Curated OER
Building Understanding of Rate of Change/Slopes Using Alice
Learners explore slope as a rate of change. In this eighth grade mathematics lesson, students investigate real-world problems to determine rate of change and transform it into a linear representation, thus determining slope. Learners...
Physics Classroom
Position-Time Graphs - Conceptual Analysis
Increasingly, colleges and employers want applicants with strong conceptual analysis skills, so give them some practice! Applying these skills to position-time graphs encourages synthesis of knowledge. To complete an installment of a...
Curated OER
Math Mediator Lesson 10: Slope
Students explore the concept of slope. In this Algebra I lesson, students investigate the definition of slope as rise over run or change in y compared to change in x. The lesson includes a real-world problem in which the height of high...
Curated OER
Slope, Intercepts, and Graphing a Line
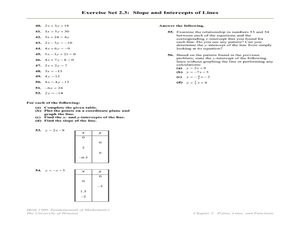
In this intercepts and slope worksheet, students find the slope and/or the x and y-intercepts in fifty-three problems. Students also graph lines using the x and y-intercepts.
Curated OER
Algebra 1: Slope as Rate
Young scholars solve problems with slopes. In this algebra lesson, students identify the slope of a line and relate it to the rate of change. They graph their lines on the TI and observe changes in the lines.
Virginia Department of Education
Slope-2-Slope
Pupils build on previous experience with slope to investigate positive, negative, zero, and undefined slope. They complete a puzzle matching slope-intercept and standard forms of linear equations.
Charleston School District
Graphing with Slope-Intercept Form
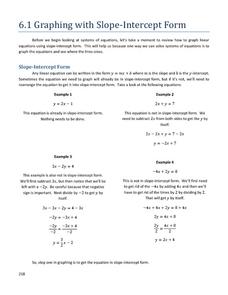
Work on graphing linear equations using the provided materials. The print and video lesson thoroughly review the concepts related to graphing linear equations in slope-intercept and standard form. The materials prepare learners for the...
EngageNY
Graphs of Linear Functions and Rate of Change
Discover an important property of linear functions. Learners use the slope formula to calculate the rates of change of linear functions. They find that linear functions have constant rates of change and use this property to determine if...
Education Development Center
Points, Slopes, and Lines
Before graphing and finding distances, learners investigate the coordinate plane and look at patterns related to plotted points. Points are plotted and the goal is to look at the horizontal and vertical distances between coordinates and...


