Hi, what do you want to do?
Curated OER
Remembering Our Veterans Data Management Project
Seventh graders utilize data collected from various sources based on Canadian military statistics to consolidate their understanding of data management. Students plan and create a PowerPoint presentation using this data including in...
Statistics Education Web
Using Dice to Introduce Sampling Distributions
Investigate the meaning of a sample proportion using this hands-on activity. Scholars collect data and realize that the larger the sample size the more closely the data resembles a normal distribution. They compare the sample proportion...
Statistics Education Web
It’s Elemental! Sampling from the Periodic Table
How random is random? Demonstrate the different random sampling methods using a hands-on activity. Pupils use various sampling techniques to choose a random sample of elements from the periodic table. They use the different samples to...
Statistics Education Web
Walk the Line
How confident are you? Explore the meaning of a confidence interval using class collected data. Learners analyze data and follow the steps to determine a 95 percent confidence interval. They then interpret the meaning of the confidence...
Curated OER
Phone Button Boggle
For this phone button boggle worksheet, students identify the number of math words they can find on a phone keypad according to given directions. This one-page worksheet contains one problem. Answers are provided.
Curated OER
Histograms and Bar Graphs
Students are introduced to histograms, bar graphs, and the concept of class interval. They use an activity and three discussions with supplemental exercises to help students explore how data can be graphically represented (and...
Curated OER
Sets an the Venn Diagram
Learners explore the characteristics of sets and Venn Diagrams. Given data, students practice determining the placement of elements in a Venn Diagram. Learners discuss the correspondence between data sets and their graphical...
National Security Agency
Line Graphs: Gone Graphing
Practice graphing and interpreting data on line graphs with 36 pages of math activities. With rationale, worksheets, and assessment suggestions, the resource is a great addition to any graphing unit.
Curated OER
Which Amusement Park Would You Choose?
Students analyze data related to amusement parks and create a spreadsheet to display the data. They read the data and predict which amusement park they think is safer, create a spreadsheet and graph, and write a proposal based on their...
Curated OER
How can my breakfast help the birds?
Sixth graders design farms with a bird's habitat in mind. In this farm lesson plan, 6th graders research how sun grown coffee destroys a bird habitat, and then they make their own farm with a bird's habitat being preserved. They then...
Curated OER
Rotation Sensor Challenge
Learners participate in a challenge to construct a rotation sensor with the highest degree of accuracy and repeatability. They conduct computer analysis of their sensor using repeated trial.
Curated OER
Whose Breakfast isn't for the Birds?
Learners explore coffee production. In this cross-curriculum rainforest ecology lesson, students research regions where coffee comes from and investigate how the native birds in the rainforest are effected by coffee...
CK-12 Foundation
Ck 12: Statistics: Box and Whisker Plots Grades 8 9
[Free Registration/Login may be required to access all resource tools.] Learn how to use box-and-whisker plots to analyze data.
CK-12 Foundation
Ck 12: Statistics: Box and Whisker Plots Grades 9 10
[Free Registration/Login may be required to access all resource tools.] Make and interpret a box-and-whisker plot for a set of data.
CK-12 Foundation
Ck 12: Statistics: Box and Whisker Plots Grades 11 12
[Free Registration/Login may be required to access all resource tools.] This Concept teaches students how to use the five-number summary to make a box-and-whisker plot.
CK-12 Foundation
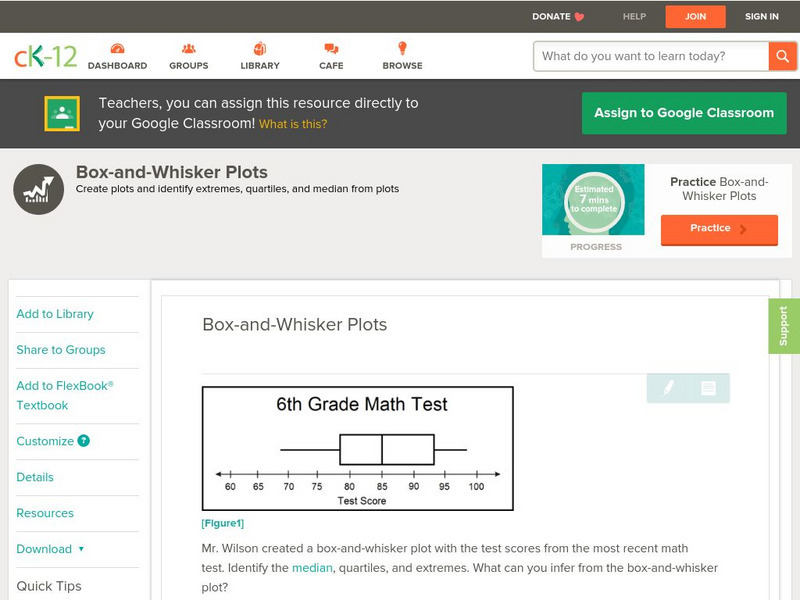
Ck 12: Statistics: Box and Whisker Plots Grade 6
[Free Registration/Login may be required to access all resource tools.] Draw and analyze a box-and-whisker plot.
Richland Community College
Richland College: Ti 82 Histograms / Box Plots
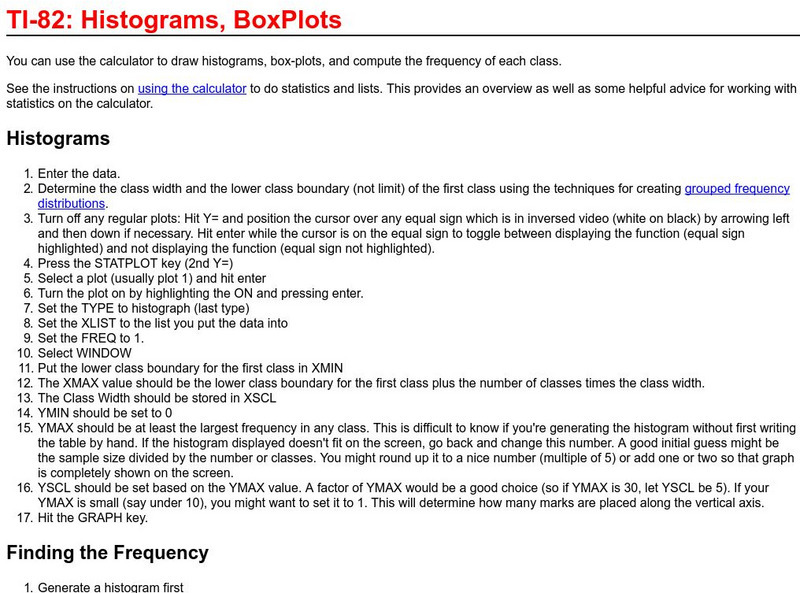
Richland College provides a step-by-step procedure on how to use a TI-82 to construct histograms and box plots and then use this to find frequency distribution.
Texas Instruments
Texas Instruments: How Tall? Describing Data With Statistical Plots
In this activity, students' will measure their heights using a motion detector and describe the data using the statistical concept called box plot.
Other
Online Statistics Education: Graphing Distributions [Pdf]
This is the second chapter of a statistics e-text developed collaboratively by Rice University, University of Houston Clear Lake, and Tufts University. It looks at many different types of data displays and the advantages and...
CK-12 Foundation
Ck 12: Statistics: Box and Whisker Plots Grade 8
[Free Registration/Login may be required to access all resource tools.] Make Box-and-Whisker Plots to represent data.
CK-12 Foundation
Ck 12: Statistics: Box and Whisker Plots Grade 7
[Free Registration/Login may be required to access all resource tools.] Draw and use box-and-whisker plots to display and organize data.
Illustrative Mathematics
Illustrative Mathematics: S Id.1,2,3 Speed Trap
A statistically-minded state trooper wondered if the speed distributions are similar for cars traveling northbound and for cars traveling southbound on an isolated stretch of interstate highway. Learners will use the data collected by...
Louisiana Department of Education
Louisiana Doe: Louisiana Believes: Eureka Math Parent Guide: Statistics
A guide to support parents as they work with their students with statistics.
Texas Education Agency
Texas Gateway: Tea Statistics: Descriptive Statistics: Introduction
In these exercises to introduce descriptive statistics, students will construct a histogram and a box plot, calculate univariate statistics, and interpret the data in the graphs.



![Online Statistics Education: Graphing Distributions [Pdf] eBook Online Statistics Education: Graphing Distributions [Pdf] eBook](https://static.lp.lexp.cloud/images/attachment_defaults/resource/large/FPO-knovation.png)
