Teach Engineering
Coordinates and the Cartesian Plane
The plot thickens to get a functional understanding. After a short review of plotting points on the coordinate plane, class members learn the difference between functions and relations in the second lesson in a series of nine. They show...
EngageNY
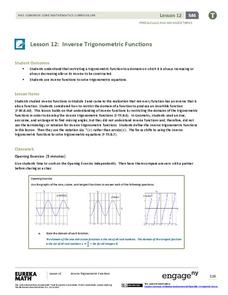
Inverse Trigonometric Functions
Build on the understanding of finding angles using trigonometric ratios. Pupils develop the definitions of inverse trigonometric functions by restricting their domains in the 13th lesson of a 16-part series. They use inverse functional...
Mathematics Vision Project
Module 1: Sequences
Take steps into sequences. An 11-lesson unit builds upon pupils' previous understanding of writing expressions to develop the idea of sequences. The resource explores both arithmetic and geometric sequences using recursive and explicit...
California Education Partners
Animals of Rhomaar
Investigate the growth rates of alien animals. Pupils study fictional animals from another planet to determine how much they grow per year. The investigators plot the growth of their animals over a period of time and then compare them to...
Curated OER
Apple Graph
Students sample three types of apples. They choose their favorite apple. They create a graph, charting the favorite apples of their classmates. They answer a series of questions.
Curated OER
It's Time to Make Time!
Pupils explore the evolution of time measurement, and explain the relationship of sunrise/sunset to length of daylight. They collect data and calculations to determine length of daylight during a given day.
Curated OER
Worksheet 39 - Polar Coordinates
In this polar coordinates worksheet, students graph polar coordinates and determine the values of a given series. This one-page worksheet contains 14 multi-step problems.
Curated OER
The Hudson's Ups and Downs
Even rivers have tides. Older elementary schoolers will discuss the Hudson River and how weather, water craft, and the ocean cause tidal fluctuation. They will examine a series of line graphs that depict tidal fluctuation, then analyze...
Curated OER
Graphing Iron Data
Students apply a data set to create a graph show how iron ore impacts an ecosystem. They explain how the iron effects the distribution and abundance of phytoplankton in coastal ecosystems using spreadsheet software.
Curated OER
Race, Education, and Income: Comparing Carter & Reagan
High school learners compare economic outcomes for 3 racial groups under the presidencies of Jimmy Carter and Ronald Reagan by analyzing a series of graphs, answering questions from a worksheet, and participating in a discussion.
Curated OER
Invasives and Marsh Birds
Students are taught that invasive plant removal can have a variety of impacts. They are shown this by using graphs. Students view maps of vegetation change on Iona Island. They discuss implications of changes on marsh birds using data...
Chicago Botanic Garden
Climate Change Around the World
Look at climate change around the world using graphical representations and a hands-on learning simulation specified to particular cities around the world. Using an interactive website, young scientists follow the provided directions to...
Willow Tree
Histograms and Venn Diagrams
There are many different options for graphing data, which can be overwhelming even for experienced mathematcians. This time, the focus is on histograms and Venn diagrams that highlight the frequency of a range of data and overlap of...
Santa Barbara City College
How to Make a Multiplication Table
Teach children how to make a multiplication table, and they'll be multiplying for life. Following this series of steps, young mathematicians learn to use patterns and the relationships between numbers to create their very own...
Illustrative Mathematics
Buying Bananas, Assessment Version
Practice with unit rates, proportions, and ratios when Carlos purchases an amount of bananas. Learners must interpret a graph to decide whether points on the same line represent similar proportional relationships. Use with lesson plans...
Chicago Botanic Garden
Historical Climate Cycles
Ice core samples give scientists access to climates of old—those from more than 800,000 years ago. Through an analysis of various temperature graphs from ice cores, tree rings, and weather stations, scholars compare historical climates...
EngageNY
Sampling Variability
Work it out — find the average time clients spend at a gym. Pupils use a table of random digits to collect a sample of times fitness buffs are working out. The scholars use their random sample to calculate an estimate of the mean of the...
University of California
The End of the Cold War (1979-1991)
Scholars use primary and secondary documents, as well as video evidence, to investigate the end of the Cold War. After completing the final installment of an eight-part series, class members better understand the issues surrounding the...
PBS
Real-World Proportional Relationships: Gender Wage Gap
When will the gender wage gap disappear? Scholars use a provided infographic to see trends in wage gap over time. They use ratios of women's wages to men's wages to determine which decades had the greatest change in the wage gap. The...
Inside Mathematics
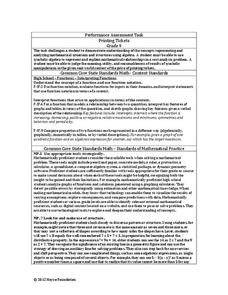
Printing Tickets
Determine the better deal. Pupils write the equation for the cost of printing tickets from different printers. They compare the costs graphically and algebraicaly to determine which printer has the best deal based upon the quantity of...
National Wildlife Federation
Get Your Techno On
Desert regions are hotter for multiple reasons; the lack of vegetation causes the sun's heat to go straight into the surface and the lack of moisture means none of the heat is being transferred into evaporation. This concept, and other...
National Wildlife Federation
The Tide is High, but I’m Holding On… Using ICESat Data to Investigate Sea Level Rise
Based on the rate of melting observed from 2003-2007 in Greenland, it would take less than 10 minutes to fill the Dallas Cowboys' Stadium. The 17th lesson in a series of 21 has scholars use the ICESat data to understand the ice mass...
Illustrative Mathematics
Robot Races
Analyze data on a graph to answer three questions after a robot race. Learners practice comparing ratios and reading points on a graph. Answers may vary on the last question based on accuracy of graphing. Use the lesson plan along with...
Federal Reserve Bank
FRED in the Classroom: Debt and Deficit
Here is a hands-on activity where your class members will discover different ways to measure the government's financial situation and work to add data and redraw graphs in order to calculate the ratio of gross federal debt held by the...


