Illustrative Mathematics
Who Has the Best Job?
Making money is important to teenagers. It is up to your apprentices to determine how much two wage earners make with their after school jobs. Participants work with a table, an equation, and a graph and compare the two workers to see...
Illustrative Mathematics
Logistic Growth Model, Abstract Version
Here learners get to flex some serious algebraic muscles through an investigation of logistic growth. The properties of the constant terms in the logistic growth formula are unraveled in a short but content-dense...
Consortium for Ocean Leadership
Nannofossils Reveal Seafloor Spreading Truth
Spread the word about seafloor spreading! Junior geologists prove Albert Wegener right in an activity that combines data analysis and deep ocean exploration. Learners analyze and graph fossil sample data taken from sites along the...
PBS
Real-World Proportional Relationships: Gender Wage Gap
When will the gender wage gap disappear? Scholars use a provided infographic to see trends in wage gap over time. They use ratios of women's wages to men's wages to determine which decades had the greatest change in the wage gap. The...
Illustrative Mathematics
Bike Race
A graph not only tells us who won the bike race, but also what happened during the race. Use this resource to help learners understand graphs. The commentary suggests waiting until the end of the year to introduce this topic, but why...
US Department of Commerce
Immigration Nation
People come and people go. Given tabular census data on the annual number of immigrants from four different regions of the world between 2000 and 2010, pupils create double bar graphs and line graphs from the data. They analyze their...
PBS
The Lowdown — What You Need to Know about Immigration Reform
We're all from somewhere. An informative interactive provides information on immigration, foreign-born residents, and deportations. Pupils interpret the graphics to analyze how these quantities have changed over time. The resource is...
Curated OER
A Saturating Exponential
Your learners analyze the familiar model of a cold beverage warming when it is taken out of the refrigerator. The general form of the equation and its graph are presented. Learners learn about the specific pieces of the function by...
Curated OER
Model Air Plane Acrobatics
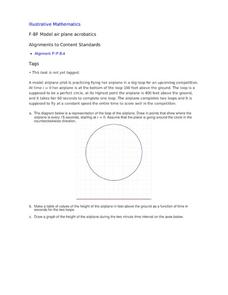
Your young airplane enthusiasts will enjoy this collaborative task of graphing an airplane's distance from the ground as it flies in a perfect circle. They will discover that they have graphed a sinusoidal function that comes from the...
Illustrative Mathematics
Robot Races
Analyze data on a graph to answer three questions after a robot race. Learners practice comparing ratios and reading points on a graph. Answers may vary on the last question based on accuracy of graphing. Use the lesson along with...
5280 Math
More or Less the Same
Tell the story of the math. Given a graph of a linear system, learners write a story that models the graph before crafting the corresponding functions. Graphs intersect at an estimated point, allowing for different variations in the...
National Council of Teachers of Mathematics
Eruptions: Old Faithful Geyser
How long do we have to wait? Given several days of times between eruptions of Old Faithful, learners create a graphical representation for two days. Groups combine their data to determine an appropriate wait time between eruptions.
Curated OER
Snack Time
In this activity, students will color the correct number of boxes in a graph to show their choices. They will then display their understanding of the graph's meaning through a teacher led class discussion.
Federal Reserve Bank
FRED in the Classroom: Measures of Inflation
Don't just tell class members about how to measure inflation, have them experience it firsthand by asking them to work with real data and construct graphs!
Illustrative Mathematics
Buying Bananas, Assessment Version
Practice with unit rates, proportions, and ratios when Carlos purchases an amount of bananas. Learners must interpret a graph to decide whether points on the same line represent similar proportional relationships. Use with lesson plans...
US Department of Commerce
Educational Attainment and Marriage Age - Testing a Correlation Coefficient's Significance
Do women with college degrees get married later? Using a provided scatter plot of the percentage of women who earn bachelor's degrees and the median age at which women first get married over time, pupils conduct a linear regression...
Illustrative Mathematics
Tides
A very simple example of a functional relationship between depth of water and time is shown here. In fact, it might be more useful to use a coastal tide book to better illustrate this real-world experience. Pupils are to count the number...
Curated OER
Button Bonanza
Collections of data represented in stem and leaf plots are organized by young statisticians as they embark some math engaging activities.
Teach Engineering
Preconditioning Balloons: Viscoelastic Biomedical Experiments
What does stretching a balloon have to do with equilibrium? Groups explore preconditioning by stretching a balloon to a point of equilibrium. They then measure the amount of force required to stretch the balloon to the same point several...
Illustrative Mathematics
Velocity vs. Distance
At the end of this activity, your number crunchers will have a better understanding as to how to describe graphs of velocity versus time and distance versus time. It is easy for learners to misinterpret graphs of velocity, so have them...
It's About Time
Factors Affecting Population Size
How do we predict future population growth? Young researchers investigate various factors affecting the size of our population. As they calculate and interpret graphs to determine factors that could potentially affect increases...
Curated OER
Exponential Functions
Your algebra learners analyze and interpret the general form and the graph of two functions. The increase of the function due to the multiplicative factor is emphasized.
Illustrative Mathematics
Throwing Baseballs
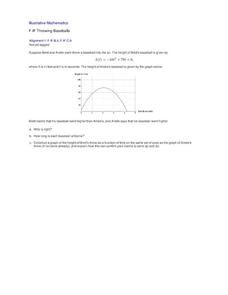
This is a wonderful exercise for learners to apply their critical thinking skills along with their knowledge of quadratic functions and parabolas. Young mathematicians investigate a real-world scenario about the height a baseball reaches...
Curated OER
The Canoe Trip, Variation 1
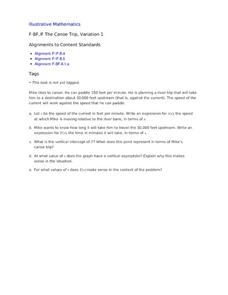
Your river sportsmen will explore an example of paddling upstream as they build functions modeling speed and time in terms of the speed of the current. They then use their algebraic models to interpret features of the function related to...


