Curated OER
Data Collection and Presentation
Middle and high schoolers collect and analyze data from four different activities. The activities include information about classmates, tallying colors of cars in a parking lot, stem and leaf plots, and making a histogram from...
Curated OER
Pudd'nhead Wilson: K-W-H-L
Prejudice is the theme of this Pudd'nhead Wilson KWHL chart. Learners fill out their charts, discuss how to find the answers to their questions, and spend some time researching a topic they want to know more about.
Rational Number Project
Initial Fraction Ideas: Lesson 3
Visual models support young mathematicians as they deepen their fractional number sense in this elementary math activity. Using fraction circle manipulatives, children explore basic unit fractions as they develop the...
Houghton Mifflin Harcourt
Celebrating Traditions: Extra Support Lessons (Theme 2)
Third graders needing extra support will benefit from the materials contained in this 42-page packet designed to be used with the Houghton Mifflin Harcourt textbook thematic unit celebrating traditions.
Santillana USA
Celebra Kwanzaa
¡Celebramos Kwanzaa! Celebrate Kwanzaa through the fictional story Celebra Kwanzaa con Botitas y sus gatitos to delightfully explain the seven principles of Kwanzaa. Dual language learners participate in reading and vocabulary...
Curated OER
Division by Fractions (Part One)
Learners demonstrate array models to illustrate division as sharing and grouping. They demonstrate the array models to compare division as sharing with division as grouping. Pupils explore division problems are typically seen as either...
Curated OER
Build Mastery: Making Inferences
Do your youngsters realize that they are constantly making inferences? Expose this inner process by bringing out the book they will be reading. Ask scholars what they think the plan is, and explain that their answers are the product of...
Curated OER
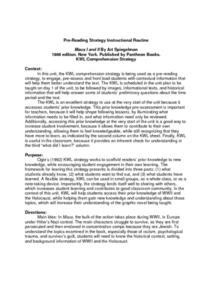
KWL Comprehension Strategy: Maus I and II
How much does your class know about World War II? Before reading Art Spiegelman's Maus I, lead your class in creating a KWL chart. Knowing the background and setting of the novel are extremely important in understanding this survivor's...
Curated OER
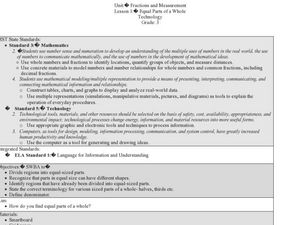
Fractions and Measurement
Using a Smart Board, or a plain ol' white board or chalkboard, the teacher pulls up a grid and demonstrates how squares and rectangles can be divided up into equal parts. The class will get their own graph paper to draw shapes and divide...
Curated OER
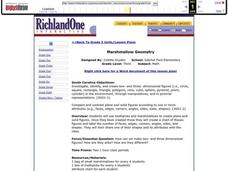
Marshmallow Geometry
Third graders create 2D and 3D shapes using marshmallows and toothpicks. In this geometry lesson, 3rd graders create their shapes and document the number of faces, edges, corners, angles, and sides. They share one shape and its...
Curated OER
Notes on Notes
Five straightforward strategies to help your pupils organize and retain information.
Curated OER
Introductions to Elections and Government
Eighth graders explore the process of election. In this elections and government lesson, 8th graders complete a K-W-L chart and research the Internet to complete a fact sheet and report on to their peers. This lesson is day two of a two...
Curated OER
Under the Sea
Young scholars identify and interpret that non-fiction books have features like a table of contents, a glossary, and an index, which can efficiently help them find information. They also identify how to narrow the search for information...
Curated OER
Inuit and Arctic Animals
Students will explore the animals and people living in the Arctic. In this science lesson, students locate Alaska on a globe, discuss its climate and geographical features, and identify common arctic animals. Students complete the first...
Curated OER
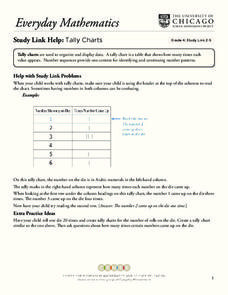
Tally Charts
For this tally charts worksheet, students discuss how to use a tally chart and how to read the chart. Once students record information on a tally chart they answer questions showing their ability to read a tally chart.
Curated OER
Column Notes-Sample Category Headings
For this column notes worksheet, students complete the graphic organizer illustrating their ability to accurately take notes using the column note format.
Curated OER
Unit 5 Lesson 01: Graphing on a Number Line
Math masters are introduced to graphing inequalities on a number line. After reviewing inequality symbols, they practice representing them on a worksheet. This simple lesson serves its purpose.
Curated OER
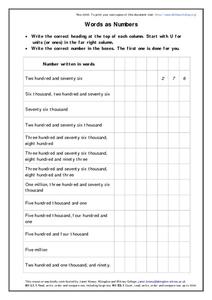
Words As Numbers
In this math learning exercise, students will read numbers written as words and then write the matching number in the correct columns of a place value chart.
We Can!
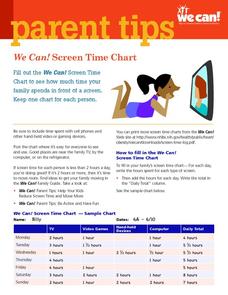
We Can! Screen Time Chart
Screens are everywhere these days, from televisions and video games to cell phones and computers. Raise awareness of excessive screen time by helping your learners track how much time they each accumulate on a daily basis looking at...
Houghton Mifflin Harcourt
Problem Solvers: English Language Development Lessons (Theme 4)
How can you teach a text to a group of readers who struggling with the language? The second in a set of three ESL lessons related to Theme 4: Problem Solvers engages English language learners by introducing vocabulary and grammar...
Curated OER
4 x 2 Chart
In this graphic organizer worksheet, students use the chart for any information recording purpose. There are 8 connected rectangles on the chart, with two rows of four columns. There are no directions for use.
Curated OER
Do Vampires Really Exist?
Pupils identify and extend a number pattern into very large values. They create and interpret a graph based on their number patterns. Students compare a math model with real-world statistics about the existence of vampires.
Curated OER
Three R's to Environmental Stewardship: Earth Day
Students explore the ways to conserve our natural resources. In this recycling, reusing, and reducing lesson students read Dinosaurs to the Rescue and apply their findings to learning ways to conserve resources. Students complete a...
Curated OER
Five Minute Adding Frenzy (B)
In this addition review worksheet, students use their math skills to solve 100 problems that require them to find sums of the numbers in the columns and rows of the chart as quickly and accurately as possible.


