Flipped Math
Calculus AB/BC - Defining Limits and Using Limit Notation
There's no limit to what one can learn about limits. The second of 18 videos in Unit 1 - Limits and Continuity focuses on understanding the basic concept of a limit. Pupils learn the definition of limits and see how to determine a limit...
Howard County Schools
Factoring Trinomials Using Tiles
What's the opposite of multiplying binomials? Learners apply their previous knowledge of multiplying binomials using algebra tiles to factor trinomials. The lesson introduces factoring as a process that uses algebra tiles to...
Curated OER
Histograms and Bar Graphs
Young scholars examine the use of bar graphs and histograms. For this data representation lesson, students investigate the proper use of bar graphs and histograms to represent data. They learn the proper geometric definitions, experience...
Curated OER
Graphing with Stems-and -Leafs
Fourth graders examine the use of stem and leaf graphs. In this stem and leaf graph lesson, 4th graders participate in teacher led lesson showing the use of the graphs. They work in groups to collect data about peanuts before making a...
Curated OER
Interpreting Graphs
Sixth graders interpret linear and nonlinear graphs. They create graphs based on a problem set. Next, they represent quantitive relationships on a graph and write a story related to graphing.
Curated OER
Representing Data 1: Using Frequency Graphs
Here is a lesson plan that focuses on the use of frequency graphs to identify a range of measures and makes sense of data in a real-world context as well as constructing frequency graphs given information about the mean, median, and...
Curated OER
Algebra: Coordinates and Straight Line Graphs
Young mathematicians review what they have previously learned about coordinates and straight line graphs. Then, they access an interactive component within the instructional activity to gain more practice with this skill. Additionally,...
Curated OER
It Has Been Rubbish For Years
Young scholars are presented with the problems of percentages and focus upon numbers in contrast to 100. They calculate problems with money and are engaged with the use of games as a teaching tool. Students also interpret data as...
CK-12 Foundation
Interpretation of Circle Graphs: Northwest Region Population Pie
Given populations of the five Northwestern states, learners create a circle graph. Using the data and the pie chart, they make comparisons between the populations of the states. Finally, the pupils determine how the chart will change...
Shodor Education Foundation
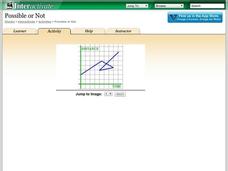
Possible or Not?
What does the graph mean? Pupils view 10 graphs and determine whether they are possible based on their contexts. The contexts are distance versus time and profit versus time.
Physics Classroom
Graph That Motion
Pupils apply their knowledge of the shape and slope of graphs to interpret the motion of an object. Three levels of difficulty provide plenty of practice with support thanks to the "Help Me!" button offered with each question.
Shodor Education Foundation
Plop It!
Build upon and stack up data to get the complete picture. Using the applet, pupils build bar graphs. As the bar graph builds, the interactive graphically displays the mean, median, and mode. Learners finish by exploring the changes in...
Curated OER
Planning a Garden Using a Grid
Third graders plan for a garden. In this garden planning lesson, 3rd graders investigate the use of a grid to accurately map out and plan for a vegetable garden. Students predict the space requirements for different vegetables.
Curated OER
Interpreting Graphs and Analyzing Data
Pupils investigate graphs and analyze the data displayed in the graph. They read a graph reflecting the birthday data for the students to read and analyze. Pupils use the graph to determine the number of birthday cards they need to make...
Alabama Learning Exchange
I Know What You Did Last Summer: A Data Graphing Project
Young scholars participate in graphing data. In this graphing data instructional activity, students make a stem and leaf plot of their summer activities. Young scholars create numerous graphs on poster boards. Students...
Curated OER
Usage and Interpretation of Graphs
Cooperative groups are formed for this graphing activity. Each group must construct a graph that represents how many eyelets (the holes for laces in shoes), are present in their group. A whole-class bar graph is eventually constructed...
Curated OER
Graphing It Daily
Students identify and demonstrate a positive learning attitude and use basic concepts and skills. Learners also communicate clearly in oral, artistic, written, and nonverbal form. Finally, students participate in the daily data...
Curated OER
Double Bar Graphs - Homework 7.1
Your learners have seen basic bar graphs, but do they have experience reading double bar graphs? This worksheet details how to draw a double bar graph and provides an example with six accompanying questions. The final question asks...
School Improvement in Maryland
Demographic Investigation
What are the factors that influence voting patterns? How do these factors influence government funding? Is participation the squeaky wheel gets the grease? Class members interpret graphs and analyze trends to determine what...
Curated OER
Exploring Renewable Energy Through Graphs and Statistics
Ninth graders identify different sources of renewable and nonrenewable energy. In this math instructional activity, learners calculate their own carbon footprint based on the carbon dioxide they create daily. They use statistics to...
Illustrative Mathematics
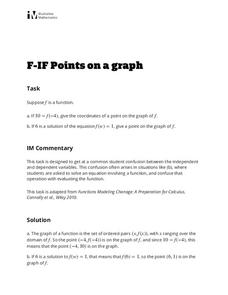
Points on a Graph
Learners practice using their knowledge of how to interpret a function and use function notation. The activity includes two questions. Given an input of a function and its output, the first question asks learners to write the ordered...
Curated OER
Drive the Data Derby
Three days of race car design and driving through the classroom while guessing probability could be a third graders dream. Learn to record car speed, distances traveled, and statistics by using calculation ranges using the mean, median,...
Curated OER
The Power of Graphical Display: How to Use Graphs to Justify a Position, Prove a Point, or Mislead the Viewer
Analyze different types of graphs with learners. They conduct a survey and determine the mean, median and mode. They then identify different techniques for collecting data.
EngageNY
Graphing Systems of Equations
Expand on learners' understanding of quadratic-linear systems. Building on the graphic understanding developed in the previous lesson, pupils learn algebraic methods of solving the systems.


