CK-12 Foundation
Pie Charts: Soda Party
Using the interactive, pupils create a pie chart that represents the percentage of sodas bought for a party. Individuals need to determine the percentage and number for the final variety of drinks. The learners determine how the...
CK-12 Foundation
Types of Data Representation: Baby Due Date Histogram
Histograms are likely to give birth to a variety of conclusions. Given the likelihood a woman is to give birth after a certain number of weeks, pupils create a histogram. The scholars use the histogram to analyze the data and answer...
CK-12 Foundation
Misleading Graphs (Identify Misleading Statistics): Are Virgos Cursed?
Is it safe to take data at its face value? Pupils use the interactive to evaluate a claim that Virgos are more likely to get into a car crash than others. Individuals determine whether another variable may be at play.
CK-12 Foundation
Multiple Bar Graphs
I scream, you scream, we all scream for ice cream bar graphs. Pupils create a multiple bar chart to represent the sales of ice cream products during the first week of summer. Using the chart, learners find the day that each of the...
CK-12 Foundation
Understand and Create Histograms: Car Sales
Create a history of car sales. Pupils create a histogram/bar graph to show the number of car sales made during the week. Using the data display, learners calculate numerical summaries of the data and find the percent of cars sold during...
CK-12 Foundation
Understand and Create Histograms: Histograms
Tally ho! Represent the frequency of ages at school. Pupils finish a tally chart to match the frequencies of ages at school. Using the frequencies, the learners create a histogram. With the aid of the histogram and the frequency table,...
CK-12 Foundation
Frequency Polygons: Constructing a Frequency Polygon
Connect the dots on frequency. Given a distribution table of scores on an assessment, learners create a frequency polygon by moving points on a graph to the correct frequency. The pupils use the display to answer questions about the...
CK-12 Foundation
Line Plots from Frequency Tables: Sleep Cycles
Demonstrate the ease of using a frequency table. An interactive lesson allows learners to create a frequency table efficiently. Challenge questions ask your classes to analyze the data represented in the frequency table.
CK-12 Foundation
Proofs: Angle Pairs and Segments—The Three Angle Problem
Finding the sum of the measures of three angles is easy, unless you have no clue what the measures are. Learners use an interactive diagram to see a geometric problem in a different way. A set of challenge questions takes them through...
CK-12 Foundation
Sampling Distribution of a Sample Mean: The Mean of the Average Ages
What does it mean to take the mean of the mean? An easy-to-use interactive has users adjust the mean ages of different samples. Finding the average of these sample means gives an estimate of the population mean.
CK-12 Foundation
Infinite Limit Type: Evaluating Limits of Rational Functions
Rational functions become less mysterious when you know about limits. Individuals use an interactive to move a rational function on a coordinate plane and to investigate function values for certain x-values. They see how the limit...
CK-12 Foundation
Infinite Limit Type: Asymptotes and End Behavior Question
There are an infinite number of reasons to use the resource. Scholars drag vertical and horizontal lines to the graph of a rational function to identify all asymptotes. They investigate the connection between asymptotes and limits to...
CK-12 Foundation
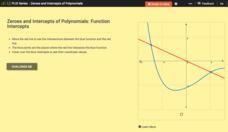
Zeroes and Intercepts of Polynomials: Function Intercepts
There is zero reason not to use the resource. Given a graph with a polynomial function and a linear function, scholars move the line in an interactive. To wrap up the lesson, they note how zeros and intersection points change.
CK-12 Foundation
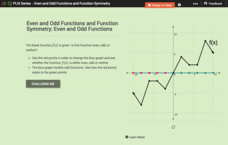
Even and Odd Functions and Function Symmetry: Even and Odd Functions
Even, odd, or neither? Pupils study even and odd functions using a well-balanced interactive. They determine whether a given function is even or odd from its graph.
CK-12 Foundation
Mode: Boxes of Oranges
See how your data stacks up. Pupils stack crates of oranges in increasing order, creating a simple bar graph. Using the graph, individuals determine measures of center and describe the shape of the distribution. Scholars determine what...
CK-12 Foundation
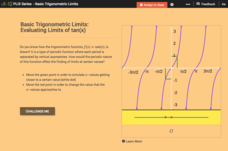
Basic Trigonometric Limits: Evaluating Limits of tan(x)
Chase a periodic moving limit. Learners graphically determine the limit of the tangent function at different input values. Using sliders, pupils find out whether the tangent function approaches the same value from the left and the right....
CK-12 Foundation
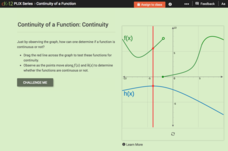
Continuity of a Function: Continuity
Does the point continually move along the graph? Pupils drag a line across two functions to determine whether they are continuous or not. They answer questions about the properties of continuous and discontinuous functions. Using their...
CK-12 Foundation
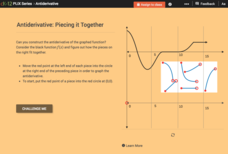
Antiderivative: Piecing it Together
Build a function backwards. Given a graph of the derivative of a function, pupils piece together a graph of the original function, the antiderivative. Learners use their graphs and the graphs of the derivatives to answer questions about...
CK-12 Foundation
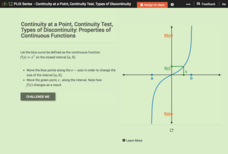
Continuity at a Point, Continuity Test, Types of Discontinuity: Properties of Continuous Functions
Take a closer look at continuous functions within given intervals. Using the parent cubic function, learners explore properties of continuous functions on intervals. Pupils interpret the Intermediate Value Theorem and the Extreme Value...
CK-12 Foundation
Constant, Identity, and Power Rules: Power Rule
Learn to gain power in finding derivatives. The resource introduces the power rule. Using the sliders in the interactive, pupils create polynomial functions and find their derivatives. Given the derivative of a polynomial, learners...
CK-12 Foundation
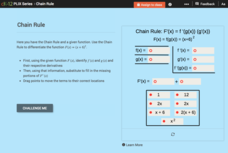
Chain Rule
Keep it on the chains. Pupils work through the steps in the chain rule using the interactive as a guide. Learners identify the two composed functions and their associated derivatives from a set of choices. They continue on to build the...
CK-12 Foundation
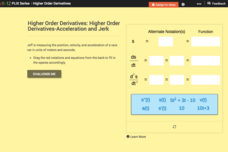
Higher Order Derivatives—Acceleration and Jerk
Accelerate your class through finding the second derivative. Using a bank of equations, pupils determine the equations for distance, velocity, and acceleration and their associated function notations. With the equations, learners answer...
CK-12 Foundation
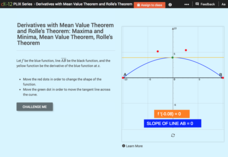
Derivatives with Mean Value Theorem and Rolle's Theorem: Maxima and Minima
Rolle with the mean values and derivatives. Scholars complete the statements of Rolle's Theorem and the Mean Value Theorem. Using the interactive to illustrate scenarios, pupils respond to questions concerning the theorems in terms of...
CK-12 Foundation
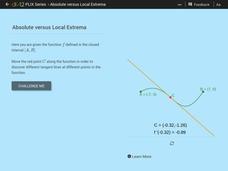
Absolute Versus Local Extrema
Get the class to take an extreme look at functions. The interactive presents a function on a closed interval with a movable tangent line. Using the given function, pupils determine the extrema, critical points, and points of...


