Illustrative Mathematics
Dimes and Quarters
Here is a coin problem where the algebra learner determines the pair of linear equations needed to solve the system. Whether the equations are taken from a table, or your scholars recognize the format of a coin problem, it is an...
Illustrative Mathematics
Guess My Number
Make a game out of solving equations. This particular activity works well for pairs of learners. Follow the instructions to have player one pick a number and player two verbally give an equation. Participants need to make sense of a...
Illustrative Mathematics
How Many Buttons?
Bring the class into the probability by having everyone count buttons on their shirts. Organize the data into the chart provided and chose different possibilities such as "female with one button" or "all learners with more than four...
Illustrative Mathematics
Overlapping Squares
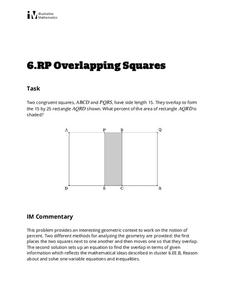
The objective of this activity is to find the percent of the area of a two squares overlapping. Mathematicians find the ratio of area for the part that overlaps to the rectangle formed. The final answer is a percent as a rate per 100....
Illustrative Mathematics
Finding an Unknown Angle
Teach your class how to apply their knowledge of geometry as they explore the unknown. In order to find an unknown angle, students must understand that rectangles have four interior right angles, that right angles have 90 degrees, and...
Illustrative Mathematics
Points on a Graph
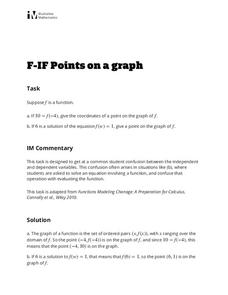
Learners practice using their knowledge of how to interpret a function and use function notation. The activity includes two questions. Given an input of a function and its output, the first question asks learners to write the ordered...
Illustrative Mathematics
Telling a Story With Graphs
Turn your algebra learners into meteorologists. Students are given three graphs that contain information about the weather in Santa Rosa, California during the month of February, 2012. Graph one shows temperatures, graph two displays the...
Curated OER
Quinoa Pasta 2
Learners discover that a system of linear equations models this mixture of quinoa and corn in a collaborative task. Your learners receive all the relevant information in this second of three variants of tasks that ask them to find the...
Curated OER
Mixing Fertilizer
Your young landscapers do concentration calculations in this problem dealing with mixing fertilizer. Learners use and analyze rational expressions within this context.
Curated OER
Parabolas and Inverse Functions
Your Algebra learners will explore what equations are functions or not functions and how to alter the domain to produce a possibility for the relations being a function with a limitted domain.
EngageNY
Analyzing Residuals (Part 1)
Just how far off is the least squares line? Using a graphing calculator, individuals or pairs create residual plots in order to determine how well a best fit line models data. Three examples walk through the calculator procedure of...
EngageNY
Modeling Relationships with a Line
What linear equation will fit this data, and how close is it? Through discussion and partner work, young mathematicians learn the procedure to determine a regression line in order to make predictions from the data.
EngageNY
Summarizing Bivariate Categorical Data with Relative Frequencies
It is hard to determine whether there is a relationship with the categorical data, because the numbers are so different. Working with a familiar two-way table on super powers, the class determines relative frequencies for each cell and...
EngageNY
Analyzing Residuals (Part 2)
Learn about patterns in residual plots with an informative math lesson. Two examples make connections between the appearance of a residual plot and whether a linear model is the best model apparent. The problem set and exit ticket...
Illustrative Mathematics
Which Function?
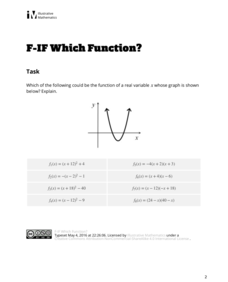
Throw some logic into quadratics and see if learners can match a vague graph to multiple equations. Young mathematicians must look at quadrant location, vertices, and intercepts to best match the graph to one or more equations.
Charleston School District
Pre-Test Unit 5: Solving Equations
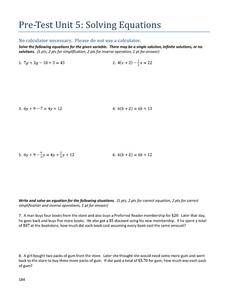
Your pupils just may know more than you think they do! A pre-test assesses their ability to solve and write equations. It includes simple quadratic and cubic equations as well.
Achieve
Dairy Barn
Agriculture is truly a math-based profession! Help the dairy farmer determine the supplies needed to complete his barn. Using given dimensions, learners build equations and use units to determine the correct amount of materials.
Achieve
BMI Calculations
Obesity is a worldwide concern. Using survey results, learners compare local BMI statistics to celebrity BMI statistics. Scholars create box plots of the data, make observations about the shape and spread of the data, and examine the...
Charleston School District
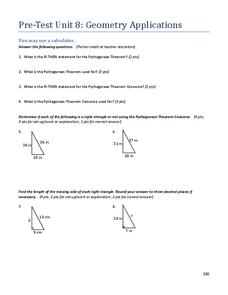
Pre-Test Unit 8: Geometry Applications
What does a squared and b squared make? C squared of course! The pre-test assesses eighth graders' knowledge of the Pythagorean Theorem, application of the Pythagorean Theorem, and finding volumes of solids.
Charleston School District
Review Unit 8: Geometry Applicaitons
Pupils complete a review worksheet that highlights the key problems from the first eight lessons in the series. Topics include the Pythagorean Theorem and its converse, as well as finding volume of three-dimensional figures.
EduGAINs
Introduction to Solving Linear Systems
Word problems offer class members an opportunity to learn the concept of solving linear systems using graphs. Individuals choose a problem based upon preferences, break into groups to discuss solution methods and whether there is...
EngageNY
Analyzing a Graph
Collaborative groups utilize their knowledge of parent functions and transformations to determine the equations associated with graphs. The graph is then related to the scenario it represents.
EngageNY
Analyzing a Data Set
Through discussions and journaling, classmates determine methods to associate types of functions with data presented in a table. Small groups then work with examples and exercises to refine their methods and find functions that work to...
EngageNY
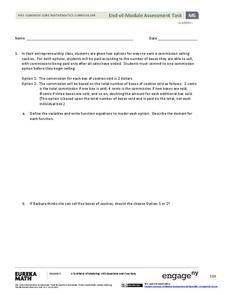
End-of-Module Assessment Task - Algebra 1 (Module 5)
This unit assessment covers the modeling process with linear, quadratic, exponential, and absolute value functions. The modeling is represented as verbal descriptions, tables, graphs, and algebraic expressions.
Other popular searches
- Dependent Variable
- Scientific Method Variables
- Writing Variable Expressions
- Variables and Expressions
- Variable Expressions
- Control Variable
- One Variable
- Equation Two Variable
- Variables Algebra Games
- Solving for the Variable
- Independent Variables
- Unknown Variable


