Virginia Department of Education
Algebra Tiles and Solving Equations
Young mathematicians solve linear equations by drawing models of algebra tiles using colored pencils. To finish, they solve the same equations algebraically and check their answers using a graphing calculator.
Mathematics Assessment Project
Maximizing Profits: Selling Boomerangs
You'll return to this resource again .. .and again ... and again. Class members determine the maximum profit of a boomerang-making business by solving a system of equations. They then review and analyze provided sample responses to...
Mathematics Assessment Project
Solving Quadratic Equations
Scholars first complete an individual assignment using a quadratic equation to model the movement of a bus around a corner. Learners then discuss their solutions with classmates and analyze the provided sample responses.
Mathematics Assessment Project
Maximizing Area: Gold Rush
Presenting ... the gold standard for a lesson. Learners first investigate a task maximizing the area of a plot for gold prospecting. They then examine a set of sample student responses to evaluate their strengths and weaknesses.
EngageNY
Word Problems Leading to Rational Equations
Show learners how to apply rational equations to the real world. Learners solve problems such as those involving averages and dilution. They write equations to model the situation and then solve them to answer the question —...
Mathematics Assessment Project
Sorting Equations and Identities
Identify the identity. Learners first solve equations to find the number of solutions. Scholars then determine if given equations are always, sometimes, or never true, leading to the concept of identities.
West Contra Costa Unified School District
Graphing Exponential Functions
Once you know how to graph y = b^x, the sky's the limit. Young mathematicians learn to graph basic exponential functions and identify key features, and then graph functions of the form f(x) = ab^(x – h) + k from the function f(x) = b^x.
Curated OER
Inquiry Unit: Modeling Maximums and Minimums
Young mathematicians explore the maximun area for patio with the added complexity of finding the mimimum cost for construction. First, they maximize the area of a yard given a limited amount of fence and plot width v. area on a...
Virginia Department of Education
Solution Concentrations
What happens when you combine 6.022 times 10 to the 23 piles of dirt into one? You make a mountain out of a mole hill. Scholars use dehydration to obtain percent composition and then calculate the molarity of the original...
Curated OER
Comparing Value for Money: Baseball Jerseys
Learners step up to the plate as they first complete an assessment task using linear equations to determine the best company from which to buy baseball jerseys. They then evaluate provided sample responses identifying strengths and...
Explore Learning
Quadratics: Polynomial Form
Throught this subscription-based sight, learners explore different aspects of the parabola by changing equations from standard to vertex form. Next, find the general form of the vextex based on the values of a, b, and c, and investigate...
Virginia Department of Education
Predicting Products and Writing Equations
A chemistry lesson presents 14 chemical reactions for scholars to observe, write the equation, and balance the equations. Additionally, it provides ways to extend the activity as it relates to catalysts.
Willow Tree
Weighted Averages
Mixtures, weighted percentages, and varying speeds make problem solving difficult. The resource give learners a strategy for tackling these types of problems effectively.
EngageNY
Multi-Step Problems—All Operations
Harness the power of algebra to solve problems. Young mathematicians learn to work out multi-step problems by applying algebraic techniques, such as solving equations and proportions. They use tape diagrams to model the problem to finish...
University of Florida
Unhealthy Forests and the News
Everyone knows a tree makes a sound when it falls, but what do we know about dying trees? Class members learn background information about Laurel wilt disease from a teacher-led presentation. Team members work with partners to read and...
Illustrative Mathematics
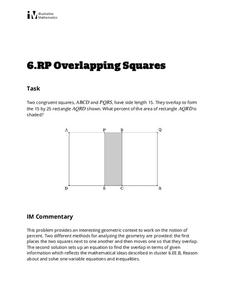
Overlapping Squares
The objective of this activity is to find the percent of the area of a two squares overlapping. Mathematicians find the ratio of area for the part that overlaps to the rectangle formed. The final answer is a percent as a rate per 100....
Curated OER
What's My Function?
Pupils use input / output tables to help them solve algebraic equations. They use patterns and relations to represent and analyze mathematical situations using algebraic symbols.
Curated OER
What's My Function?
Fifth graders utilize input/output tables to help them solve algebraic equations. They incorporate patterns, number sequences and relations to represent and analyze mathematical problems and number relationships using algebraic symbols.
Curated OER
Graphs and Transformations of Functions
Is it possible to solve quadratic equations by factoring? It is, and your class will graph quadratic equation and functions too. They perform transformation on their graphs showing increasing and decreasing intervals, domain, and range....
Curated OER
What Is It?
You have to love lessons that foster problem solving strategies. This one has upper graders devise and employ their own strategy to solve given problems after they have used classics like guess/check, substitution, make a table, and look...
Curated OER
Graphing and the Coordinate Plane
Students examine the four quadrants of Cartesian coordinate plane. They play maze games and coordinate games to discover how to read and plot points on the plane. Students plot points on the coordinate plane and examine the ratio of...
Curated OER
DISCOUNT LENSES ( GELATIN WAVE GUIDES)
Learners study attributes associated with concept of fiber optics is done using a labmade fiber optic from clear molded gelatin. A variety of shapes can be cut and pieced together to form a conduit to transmit the laser beam by internal...
Curated OER
Using Data Analysis to Review Linear Functions
Using either data provided or data that has been collected, young mathematicians graph linear functions to best fit their scatterplot. They also analyze their data and make predicitons based on the data. This lesson is intended as a...
