Concord Consortium
Visualizing Electric Fields and Forces
Shock your class with an exciting interactive about electric fields! Physical science superstars visualize the transparent world of electric fields by changing the charge on a stationary object. They then observe changes in the resulting...
CK-12 Foundation
Radical Equations: Geometric Visual of a Square Root
How can you draw a number? A set of questions takes learners through the reasoning for why a geometric construction can be drawn to represent the square root of a number. An interactive helps visualize the construction.
PBS
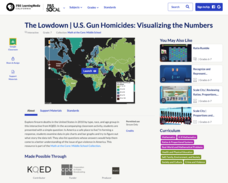
The Lowdown — U.S. Gun Homicides: Visualizing the Numbers
Is gun violence a big issue in America? Pupils explore gun deaths by type, race, and age group in a Math at the Core: Ratios interactive. The class tries to determine whether America is a safe place to live and use bar graphs and pie...
American Battle Monuments Commission
World War II: A Visual History
Explore the enormity of World War II, including its causes, prominent battles, and historical figures, with an interactive map and timeline. Divided into each year from 1939 to 1945, as well as sections pre- and post-war, the resource...
Scholastic
Study Jams! Area of a Parallelogram
Get introduced to the idea of square units and how to calculate the area of a parallelogram. The resource provides a visual lesson to measuring different types of this shape and how it relates to square units.
Scholastic
Study Jams! Volume
Young mathematicians may solve for cubic units but do they know what that is? This video does a great job of visually explaining not only how to find cubic volume, but what it means in relatable terms.
Chemistry Collective
Osmotic Pressure: Spontaneous Balloon Popping
Visualize osmosis using an interactive activity. As learners monitor a simulation, they witness the particle movement through the membrane. A balloon represents the cellular membrane and 'pops' as osmosis creates an imbalance of...
McGraw Hill
Kepler's Third Law Interactive
Common sense says that the farther a planet is from the sun, the longer the orbit. Kepler turned common sense into his third law by quantifying this relationship. Classes explore Kepler's Third Law through an interactive tutorial. They...
McGraw Hill
Eclipse Interactive
Give your classes a visual model of a rare phenomenon. Learners use an interactive activity to explore the connection of location, tilt, and size to the occurrence of an eclipse. Pupils consider both solar and lunar eclipses throughout...
CK-12 Foundation
Sum and Difference of Cubes: Stacking Blocks
Investigate polynomial factoring patterns by finding a connection to volume. As learners build a three-dimensional solid from smaller solids, they convert the visual model to a mathematical expression. Their models represent the sum of...
Howard Hughes Medical Institute
Visualizing Gene-Expression Patterns
How do genetics gurus know so much about gene expression? See traits materialize before your very eyes using a presentation with embedded simulations. Science scholars develop an understanding of the techniques used to follow the work of...
CK-12 Foundation
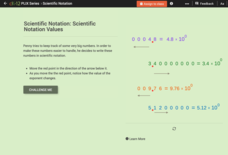
Scientific Notation Values
Scientific notation is the focus of a five-question interactive. A model with movable points offers a visual reference to help solve true or false, multiple-choice, and fill in the blank questions. A discussion question challenges...
Curated OER
Identify The Shape of Scale
In this online interactive visual discrimination worksheet, students respond to 1 multiple choice question that requires them to determine the name of the shape pictured.
American Battle Monuments Commission
The Great War: A Visual History
Immerse yourself in the military operatives of the Great War with an interactive timeline and map. As high schoolers click on each year of World War I, they can select individual battles, campaigns, troop movements, and notable victories...
CK-12 Foundation
Visual Patterns: Building the Queen's Tower
A resource fit for a queen. Scholars recognize and continue a pattern in towers people are building for a queen. They write and use an algebraic expression for the number of tiles in the towers.
CK-12 Foundation
Visual Patterns: Balloons
Balloons aren't just for little kids; they can teach important math concepts, too. Individuals use an interactive to continue a color pattern with balloons. They continue the pattern and write a mathematical expression to represent the...
CK-12 Foundation
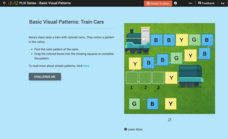
Basic Visual Patterns: Train Cars
An interactive comprised of five questions challenges young scholars to complete a simple pattern. After examining a train with colored carts, learners arrange a green, blue, and yellow block into their corresponding space. Questions are...
Curated OER
Actions in Progress
English language learners will find this practice particularly helpful. They match the sentences to their visual depiction. In the second exercise, they fill in the missing words. They use the sentences in the first activity to discover...
Scholastic
Study Jams! The Moon
Take your class to the moon and back with this compact slide show. A mix of computer-generated images and photographs are supported by explanatory text. Observers learn about the moon's movements, its physical features, and its phases....
GeoGebra
GeoGebra Graphing Calculator
So, exactly, what does it look like? The easily usable graphing calculator allows pupils to visualize the graph of equations and inequalities. The interactive supports any algebraic graph needed for high school mathematics and then some.
Annenberg Foundation
Geometry 3D Shapes: Euler's Theorem
How do you get a theorem named after you? Euler knows what it takes! The third lesson of five asks pupils to use an interactive activity to compare the faces, vertices, and edges of seven different three-dimensional solids. They use...
Digital Dream Lab's Art Game Swatch Out!
Why did we create an art game? Teachers reported to us that students struggle in art the most with composition of colors. For example, students often think "pink" is composed of random colors or that pink is its own color, instead of...
CK-12 Foundation
Intermediate Value Theorem, Existence of Solutions: Function Exploration
Does the value exist? The interactive allows pupils to visualize the Intermediate Value Theorem. Using the visualization, individuals respond to questions using specific values and general values. The class comes to the conclusion what...
CK-12 Foundation
Slope of a Tangent Line: Slope of the Tangent and Secant Lines
Learn to find the slope through a single point. The interactive provides a visualization of how to find the slope of a tangent line. With the aid of the visualization, pupils see the definition of the derivative in action. Class members...
Other popular searches
- Visual Arts
- Visually Impaired
- Visual Art Self Portrait
- Visual Art Lesson Plans
- Teacher Resources Visual Art
- Visual Art Lessons
- Visual and Performing Arts
- Visual Art Lessons Symmetry
- Visual Discrimination
- Visual=art
- Visual Art Tessellations
- Visually Impaired Blind


